Greek vs Dutch Family Poverty
COMPARE
Greek
Dutch
Family Poverty
Family Poverty Comparison
Greeks
Dutch
7.5%
FAMILY POVERTY
99.4/ 100
METRIC RATING
35th/ 347
METRIC RANK
7.8%
FAMILY POVERTY
98.3/ 100
METRIC RATING
66th/ 347
METRIC RANK
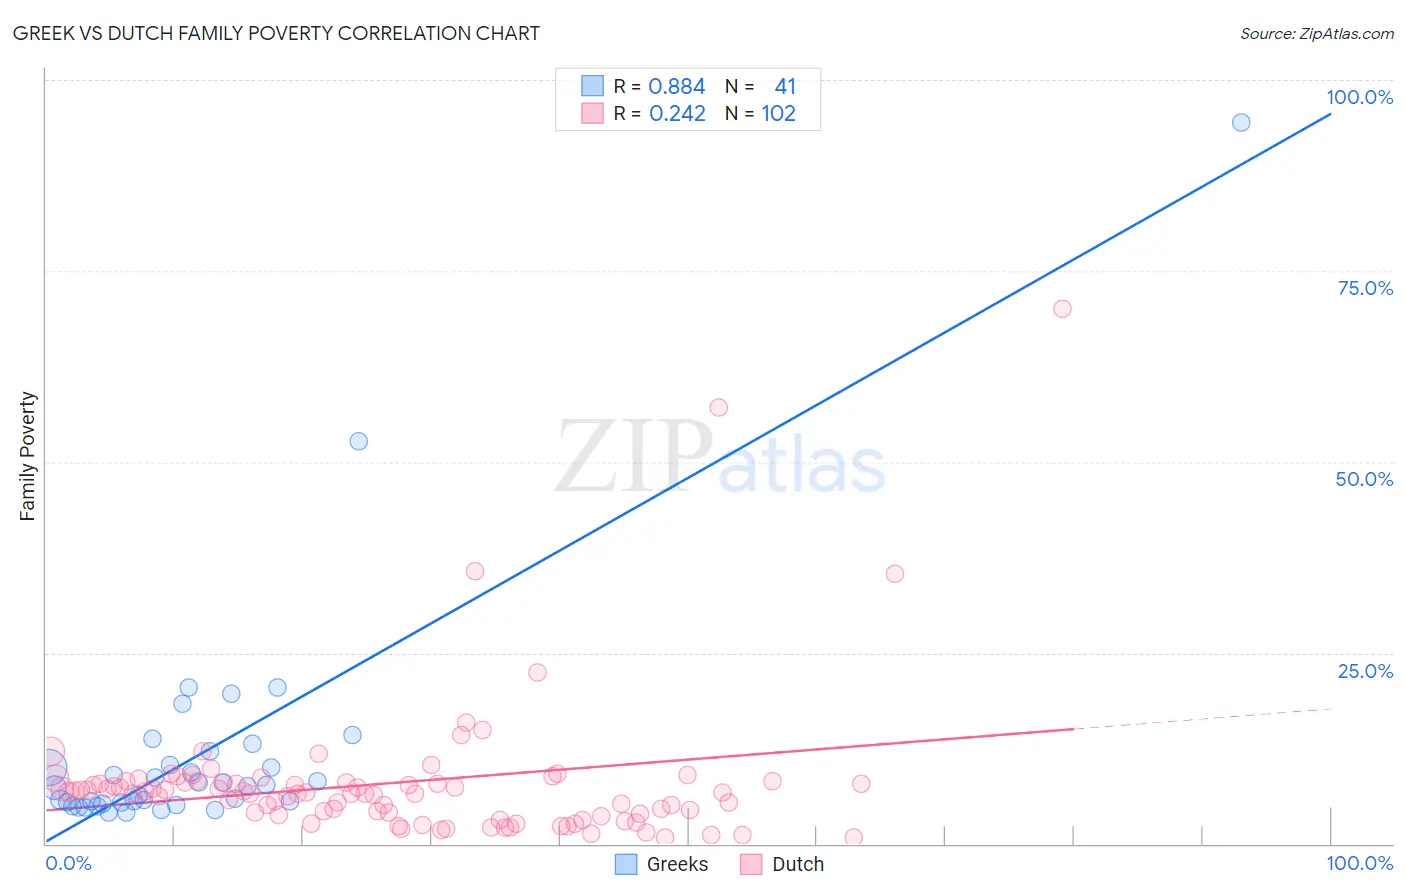
Greek vs Dutch Family Poverty Correlation Chart
The statistical analysis conducted on geographies consisting of 480,426,664 people shows a very strong positive correlation between the proportion of Greeks and poverty level among families in the United States with a correlation coefficient (R) of 0.884 and weighted average of 7.5%. Similarly, the statistical analysis conducted on geographies consisting of 550,370,007 people shows a weak positive correlation between the proportion of Dutch and poverty level among families in the United States with a correlation coefficient (R) of 0.242 and weighted average of 7.8%, a difference of 4.1%.
Family Poverty Correlation Summary
| Measurement | Greek | Dutch |
| Minimum | 4.1% | 0.79% |
| Maximum | 94.4% | 70.0% |
| Range | 90.3% | 69.2% |
| Mean | 11.7% | 8.0% |
| Median | 7.5% | 6.7% |
| Interquartile 25% (IQ1) | 5.3% | 4.0% |
| Interquartile 75% (IQ3) | 11.2% | 8.1% |
| Interquartile Range (IQR) | 5.9% | 4.1% |
| Standard Deviation (Sample) | 15.6% | 9.6% |
| Standard Deviation (Population) | 15.4% | 9.5% |
Similar Demographics by Family Poverty
Demographics Similar to Greeks by Family Poverty
In terms of family poverty, the demographic groups most similar to Greeks are Turkish (7.5%, a difference of 0.010%), Estonian (7.5%, a difference of 0.18%), Bolivian (7.5%, a difference of 0.43%), Carpatho Rusyn (7.5%, a difference of 0.49%), and Slovene (7.5%, a difference of 0.52%).
| Demographics | Rating | Rank | Family Poverty |
| Immigrants | Korea | 99.6 /100 | #28 | Exceptional 7.4% |
| Immigrants | Northern Europe | 99.6 /100 | #29 | Exceptional 7.4% |
| Italians | 99.6 /100 | #30 | Exceptional 7.4% |
| Czechs | 99.6 /100 | #31 | Exceptional 7.4% |
| Poles | 99.5 /100 | #32 | Exceptional 7.4% |
| Immigrants | Japan | 99.5 /100 | #33 | Exceptional 7.4% |
| Russians | 99.5 /100 | #34 | Exceptional 7.5% |
| Greeks | 99.4 /100 | #35 | Exceptional 7.5% |
| Turks | 99.4 /100 | #36 | Exceptional 7.5% |
| Estonians | 99.4 /100 | #37 | Exceptional 7.5% |
| Bolivians | 99.3 /100 | #38 | Exceptional 7.5% |
| Carpatho Rusyns | 99.3 /100 | #39 | Exceptional 7.5% |
| Slovenes | 99.3 /100 | #40 | Exceptional 7.5% |
| Immigrants | Australia | 99.2 /100 | #41 | Exceptional 7.6% |
| Scandinavians | 99.1 /100 | #42 | Exceptional 7.6% |
Demographics Similar to Dutch by Family Poverty
In terms of family poverty, the demographic groups most similar to Dutch are Northern European (7.8%, a difference of 0.010%), Australian (7.8%, a difference of 0.040%), Immigrants from Bulgaria (7.8%, a difference of 0.060%), Immigrants from Belgium (7.8%, a difference of 0.060%), and Korean (7.8%, a difference of 0.070%).
| Demographics | Rating | Rank | Family Poverty |
| Europeans | 98.7 /100 | #59 | Exceptional 7.7% |
| Immigrants | Greece | 98.7 /100 | #60 | Exceptional 7.7% |
| Immigrants | Netherlands | 98.6 /100 | #61 | Exceptional 7.7% |
| Macedonians | 98.6 /100 | #62 | Exceptional 7.8% |
| Zimbabweans | 98.4 /100 | #63 | Exceptional 7.8% |
| Koreans | 98.3 /100 | #64 | Exceptional 7.8% |
| Immigrants | Bulgaria | 98.3 /100 | #65 | Exceptional 7.8% |
| Dutch | 98.3 /100 | #66 | Exceptional 7.8% |
| Northern Europeans | 98.3 /100 | #67 | Exceptional 7.8% |
| Australians | 98.2 /100 | #68 | Exceptional 7.8% |
| Immigrants | Belgium | 98.2 /100 | #69 | Exceptional 7.8% |
| Immigrants | Canada | 98.2 /100 | #70 | Exceptional 7.8% |
| Cambodians | 98.2 /100 | #71 | Exceptional 7.8% |
| Immigrants | Romania | 98.2 /100 | #72 | Exceptional 7.8% |
| Austrians | 98.2 /100 | #73 | Exceptional 7.8% |