Greek vs Thai Single Father Poverty
COMPARE
Greek
Thai
Single Father Poverty
Single Father Poverty Comparison
Greeks
Thais
17.1%
SINGLE FATHER POVERTY
1.3/ 100
METRIC RATING
247th/ 347
METRIC RANK
14.5%
SINGLE FATHER POVERTY
100.0/ 100
METRIC RATING
30th/ 347
METRIC RANK
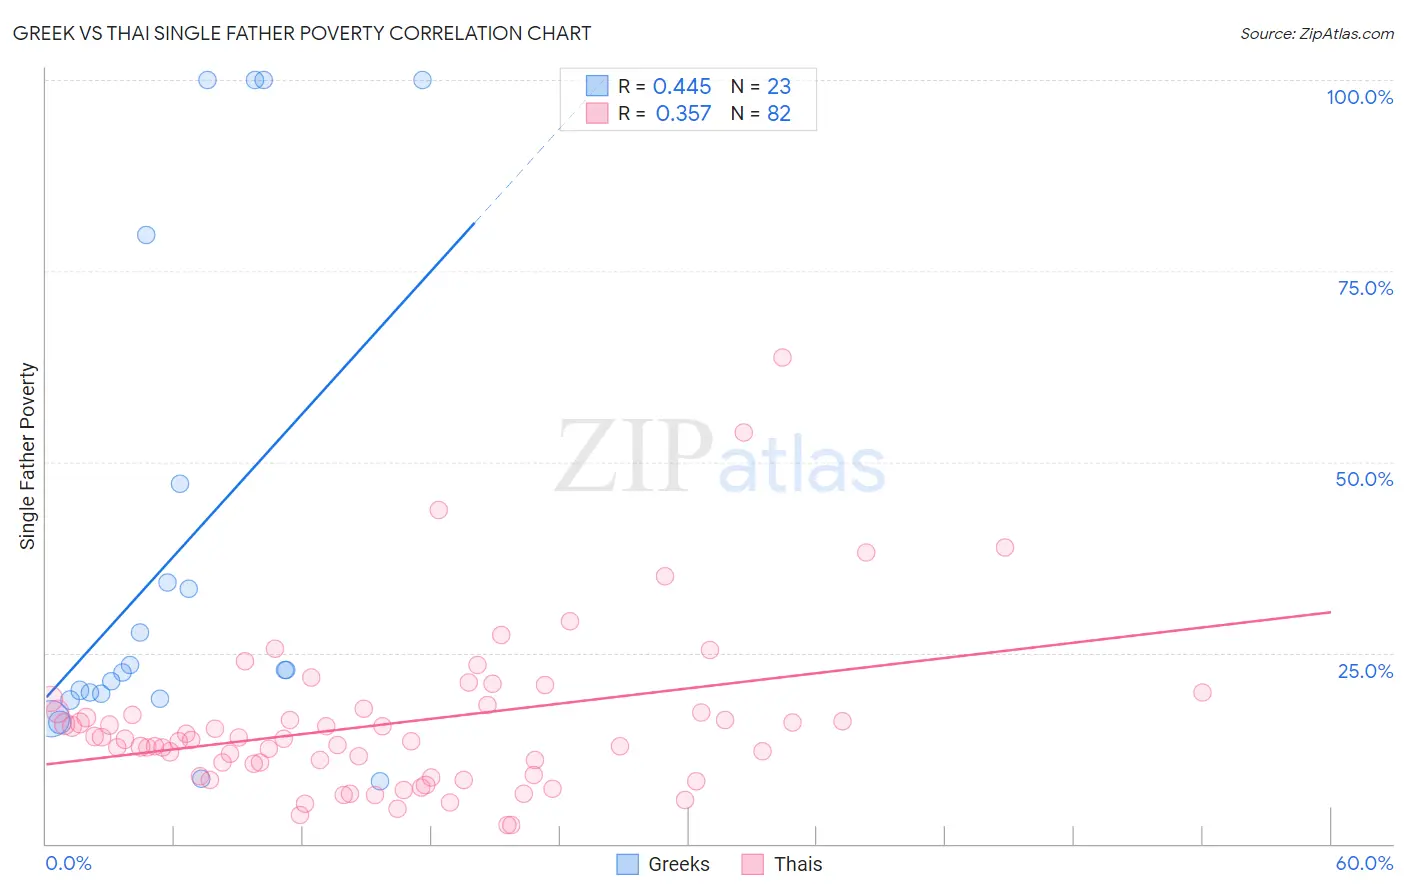
Greek vs Thai Single Father Poverty Correlation Chart
The statistical analysis conducted on geographies consisting of 361,572,090 people shows a moderate positive correlation between the proportion of Greeks and poverty level among single fathers in the United States with a correlation coefficient (R) of 0.445 and weighted average of 17.1%. Similarly, the statistical analysis conducted on geographies consisting of 363,511,447 people shows a mild positive correlation between the proportion of Thais and poverty level among single fathers in the United States with a correlation coefficient (R) of 0.357 and weighted average of 14.5%, a difference of 17.5%.
Single Father Poverty Correlation Summary
| Measurement | Greek | Thai |
| Minimum | 8.2% | 2.5% |
| Maximum | 100.0% | 63.6% |
| Range | 91.8% | 61.2% |
| Mean | 38.3% | 15.7% |
| Median | 22.7% | 13.6% |
| Interquartile 25% (IQ1) | 19.0% | 9.0% |
| Interquartile 75% (IQ3) | 47.2% | 17.4% |
| Interquartile Range (IQR) | 28.2% | 8.4% |
| Standard Deviation (Sample) | 32.3% | 10.5% |
| Standard Deviation (Population) | 31.6% | 10.4% |
Similar Demographics by Single Father Poverty
Demographics Similar to Greeks by Single Father Poverty
In terms of single father poverty, the demographic groups most similar to Greeks are Czechoslovakian (17.1%, a difference of 0.0%), Canadian (17.1%, a difference of 0.050%), Immigrants from Ireland (17.1%, a difference of 0.10%), Trinidadian and Tobagonian (17.0%, a difference of 0.14%), and Honduran (17.0%, a difference of 0.18%).
| Demographics | Rating | Rank | Single Father Poverty |
| Finns | 2.6 /100 | #240 | Tragic 16.9% |
| Czechs | 2.3 /100 | #241 | Tragic 17.0% |
| Moroccans | 2.1 /100 | #242 | Tragic 17.0% |
| Immigrants | Cabo Verde | 1.6 /100 | #243 | Tragic 17.0% |
| Hondurans | 1.6 /100 | #244 | Tragic 17.0% |
| Trinidadians and Tobagonians | 1.5 /100 | #245 | Tragic 17.0% |
| Immigrants | Ireland | 1.4 /100 | #246 | Tragic 17.1% |
| Greeks | 1.3 /100 | #247 | Tragic 17.1% |
| Czechoslovakians | 1.3 /100 | #248 | Tragic 17.1% |
| Canadians | 1.3 /100 | #249 | Tragic 17.1% |
| Austrians | 1.1 /100 | #250 | Tragic 17.1% |
| Luxembourgers | 1.1 /100 | #251 | Tragic 17.1% |
| Croatians | 1.0 /100 | #252 | Tragic 17.1% |
| Cree | 1.0 /100 | #253 | Tragic 17.1% |
| Immigrants | Honduras | 0.9 /100 | #254 | Tragic 17.1% |
Demographics Similar to Thais by Single Father Poverty
In terms of single father poverty, the demographic groups most similar to Thais are Somali (14.5%, a difference of 0.040%), Icelander (14.5%, a difference of 0.080%), Immigrants from South Central Asia (14.5%, a difference of 0.15%), Asian (14.6%, a difference of 0.24%), and Nepalese (14.4%, a difference of 0.68%).
| Demographics | Rating | Rank | Single Father Poverty |
| Immigrants | Egypt | 100.0 /100 | #23 | Exceptional 14.4% |
| Immigrants | South Eastern Asia | 100.0 /100 | #24 | Exceptional 14.4% |
| Iranians | 100.0 /100 | #25 | Exceptional 14.4% |
| Spanish American Indians | 100.0 /100 | #26 | Exceptional 14.4% |
| Nepalese | 100.0 /100 | #27 | Exceptional 14.4% |
| Immigrants | South Central Asia | 100.0 /100 | #28 | Exceptional 14.5% |
| Somalis | 100.0 /100 | #29 | Exceptional 14.5% |
| Thais | 100.0 /100 | #30 | Exceptional 14.5% |
| Icelanders | 100.0 /100 | #31 | Exceptional 14.5% |
| Asians | 100.0 /100 | #32 | Exceptional 14.6% |
| Okinawans | 100.0 /100 | #33 | Exceptional 14.6% |
| Egyptians | 100.0 /100 | #34 | Exceptional 14.7% |
| Immigrants | Bolivia | 100.0 /100 | #35 | Exceptional 14.7% |
| Immigrants | Indonesia | 100.0 /100 | #36 | Exceptional 14.7% |
| Immigrants | Eastern Africa | 100.0 /100 | #37 | Exceptional 14.7% |