Ghanaian vs Immigrants from Jamaica Median Family Income
COMPARE
Ghanaian
Immigrants from Jamaica
Median Family Income
Median Family Income Comparison
Ghanaians
Immigrants from Jamaica
$98,877
MEDIAN FAMILY INCOME
12.6/ 100
METRIC RATING
204th/ 347
METRIC RANK
$89,268
MEDIAN FAMILY INCOME
0.1/ 100
METRIC RATING
277th/ 347
METRIC RANK
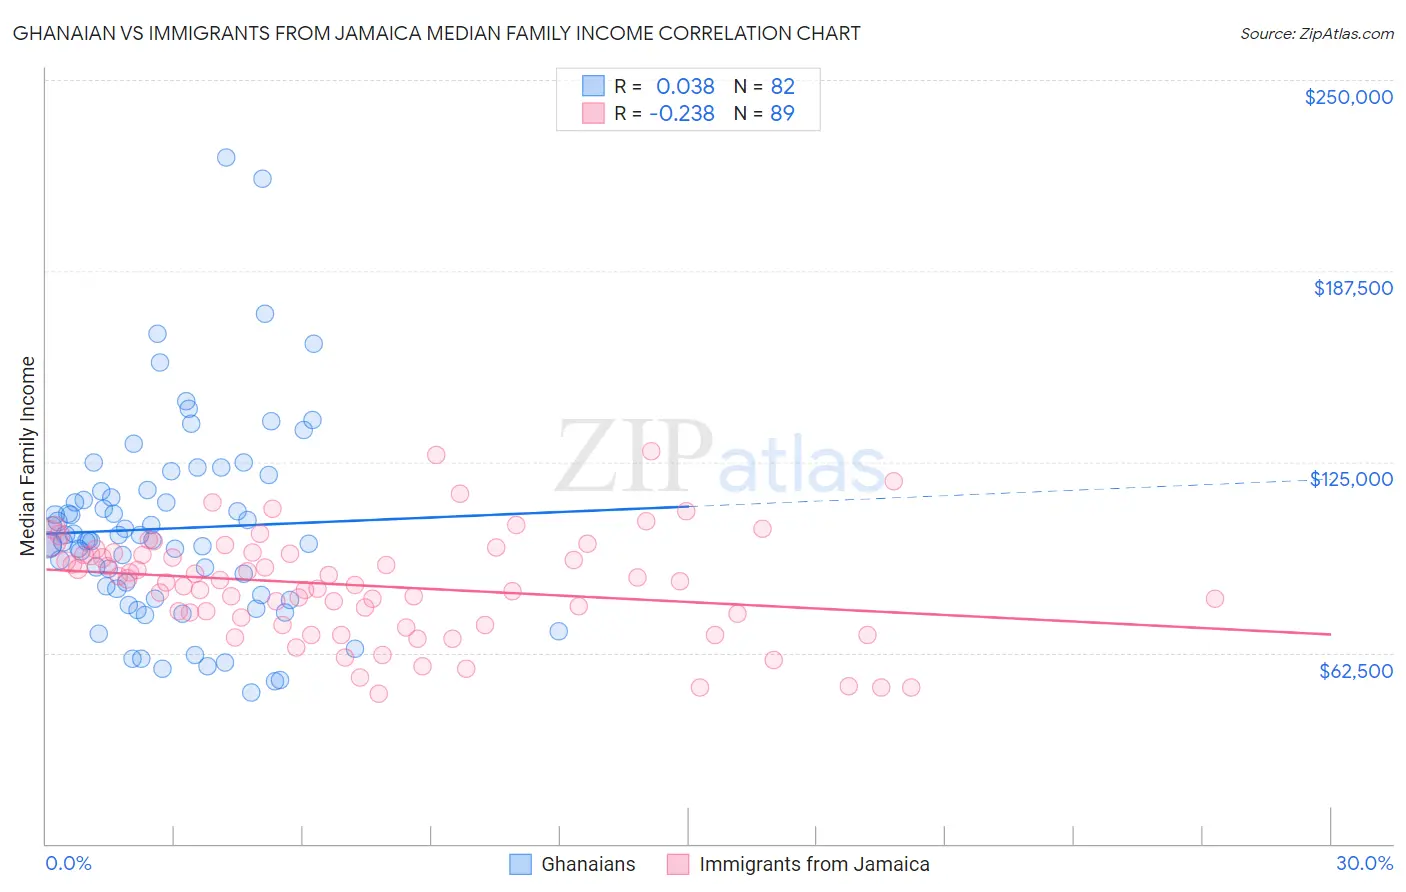
Ghanaian vs Immigrants from Jamaica Median Family Income Correlation Chart
The statistical analysis conducted on geographies consisting of 190,476,468 people shows no correlation between the proportion of Ghanaians and median family income in the United States with a correlation coefficient (R) of 0.038 and weighted average of $98,877. Similarly, the statistical analysis conducted on geographies consisting of 301,510,584 people shows a weak negative correlation between the proportion of Immigrants from Jamaica and median family income in the United States with a correlation coefficient (R) of -0.238 and weighted average of $89,268, a difference of 10.8%.
Median Family Income Correlation Summary
| Measurement | Ghanaian | Immigrants from Jamaica |
| Minimum | $49,625 | $49,200 |
| Maximum | $224,545 | $128,421 |
| Range | $174,920 | $79,221 |
| Mean | $103,158 | $84,512 |
| Median | $99,461 | $85,741 |
| Interquartile 25% (IQ1) | $81,320 | $72,845 |
| Interquartile 75% (IQ3) | $115,481 | $95,144 |
| Interquartile Range (IQR) | $34,161 | $22,299 |
| Standard Deviation (Sample) | $32,730 | $17,087 |
| Standard Deviation (Population) | $32,529 | $16,991 |
Similar Demographics by Median Family Income
Demographics Similar to Ghanaians by Median Family Income
In terms of median family income, the demographic groups most similar to Ghanaians are Hawaiian ($98,869, a difference of 0.010%), Immigrants from Iraq ($98,786, a difference of 0.090%), Aleut ($98,702, a difference of 0.18%), Immigrants from Uruguay ($98,205, a difference of 0.68%), and Scotch-Irish ($99,591, a difference of 0.72%).
| Demographics | Rating | Rank | Median Family Income |
| Immigrants | Cameroon | 22.8 /100 | #197 | Fair $100,289 |
| Immigrants | Africa | 22.5 /100 | #198 | Fair $100,256 |
| Yugoslavians | 21.3 /100 | #199 | Fair $100,119 |
| Spanish | 20.1 /100 | #200 | Fair $99,977 |
| Immigrants | Thailand | 19.0 /100 | #201 | Poor $99,840 |
| Whites/Caucasians | 18.7 /100 | #202 | Poor $99,800 |
| Scotch-Irish | 17.1 /100 | #203 | Poor $99,591 |
| Ghanaians | 12.6 /100 | #204 | Poor $98,877 |
| Hawaiians | 12.5 /100 | #205 | Poor $98,869 |
| Immigrants | Iraq | 12.1 /100 | #206 | Poor $98,786 |
| Aleuts | 11.6 /100 | #207 | Poor $98,702 |
| Immigrants | Uruguay | 9.2 /100 | #208 | Tragic $98,205 |
| Immigrants | Colombia | 8.7 /100 | #209 | Tragic $98,067 |
| Puget Sound Salish | 8.2 /100 | #210 | Tragic $97,958 |
| Immigrants | Sudan | 7.4 /100 | #211 | Tragic $97,737 |
Demographics Similar to Immigrants from Jamaica by Median Family Income
In terms of median family income, the demographic groups most similar to Immigrants from Jamaica are Immigrants from Zaire ($89,285, a difference of 0.020%), Immigrants from Grenada ($89,249, a difference of 0.020%), Immigrants from Belize ($89,197, a difference of 0.080%), British West Indian ($88,987, a difference of 0.32%), and Blackfeet ($88,717, a difference of 0.62%).
| Demographics | Rating | Rank | Median Family Income |
| Jamaicans | 0.2 /100 | #270 | Tragic $90,581 |
| Iroquois | 0.2 /100 | #271 | Tragic $90,543 |
| Immigrants | Liberia | 0.2 /100 | #272 | Tragic $90,450 |
| Immigrants | Micronesia | 0.2 /100 | #273 | Tragic $90,345 |
| Spanish Americans | 0.2 /100 | #274 | Tragic $90,322 |
| Immigrants | St. Vincent and the Grenadines | 0.2 /100 | #275 | Tragic $90,094 |
| Immigrants | Zaire | 0.1 /100 | #276 | Tragic $89,285 |
| Immigrants | Jamaica | 0.1 /100 | #277 | Tragic $89,268 |
| Immigrants | Grenada | 0.1 /100 | #278 | Tragic $89,249 |
| Immigrants | Belize | 0.1 /100 | #279 | Tragic $89,197 |
| British West Indians | 0.1 /100 | #280 | Tragic $88,987 |
| Blackfeet | 0.1 /100 | #281 | Tragic $88,717 |
| Comanche | 0.1 /100 | #282 | Tragic $88,556 |
| Bangladeshis | 0.1 /100 | #283 | Tragic $88,358 |
| Indonesians | 0.1 /100 | #284 | Tragic $88,301 |