Immigrants from Hong Kong vs Haitian Single Mother Poverty
COMPARE
Immigrants from Hong Kong
Haitian
Single Mother Poverty
Single Mother Poverty Comparison
Immigrants from Hong Kong
Haitians
24.4%
SINGLE MOTHER POVERTY
100.0/ 100
METRIC RATING
5th/ 347
METRIC RANK
29.8%
SINGLE MOTHER POVERTY
13.3/ 100
METRIC RATING
210th/ 347
METRIC RANK
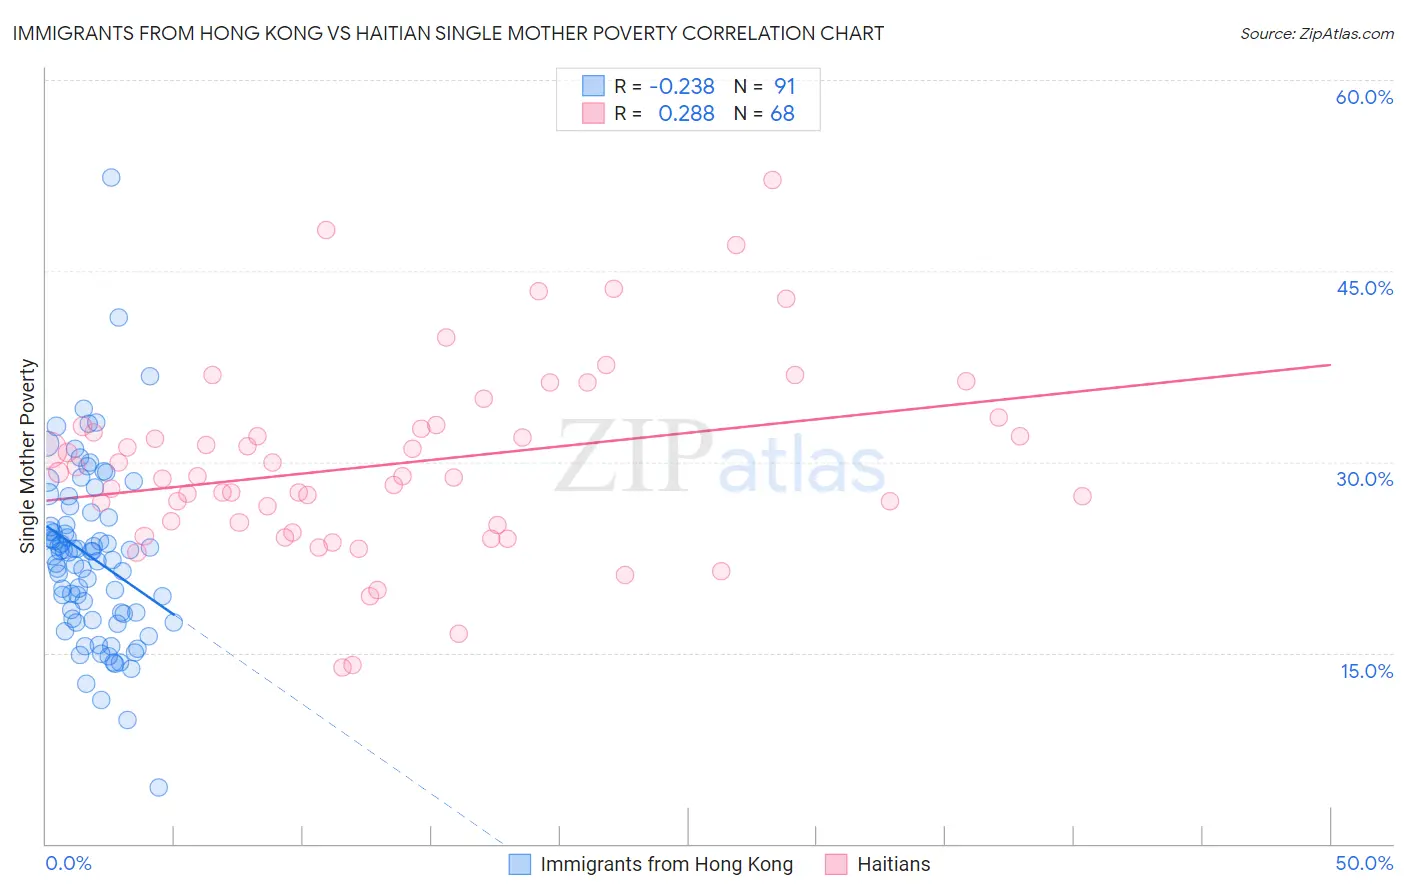
Immigrants from Hong Kong vs Haitian Single Mother Poverty Correlation Chart
The statistical analysis conducted on geographies consisting of 248,457,353 people shows a weak negative correlation between the proportion of Immigrants from Hong Kong and poverty level among single mothers in the United States with a correlation coefficient (R) of -0.238 and weighted average of 24.4%. Similarly, the statistical analysis conducted on geographies consisting of 283,035,153 people shows a weak positive correlation between the proportion of Haitians and poverty level among single mothers in the United States with a correlation coefficient (R) of 0.288 and weighted average of 29.8%, a difference of 22.4%.
Single Mother Poverty Correlation Summary
| Measurement | Immigrants from Hong Kong | Haitian |
| Minimum | 4.5% | 13.8% |
| Maximum | 52.3% | 52.2% |
| Range | 47.8% | 38.4% |
| Mean | 22.5% | 29.8% |
| Median | 22.9% | 28.8% |
| Interquartile 25% (IQ1) | 17.7% | 25.1% |
| Interquartile 75% (IQ3) | 25.6% | 32.7% |
| Interquartile Range (IQR) | 7.9% | 7.6% |
| Standard Deviation (Sample) | 7.0% | 7.4% |
| Standard Deviation (Population) | 6.9% | 7.4% |
Similar Demographics by Single Mother Poverty
Demographics Similar to Immigrants from Hong Kong by Single Mother Poverty
In terms of single mother poverty, the demographic groups most similar to Immigrants from Hong Kong are Filipino (24.3%, a difference of 0.23%), Thai (24.5%, a difference of 0.49%), Chinese (24.6%, a difference of 1.0%), Immigrants from Taiwan (23.9%, a difference of 2.1%), and Immigrants from India (23.8%, a difference of 2.4%).
| Demographics | Rating | Rank | Single Mother Poverty |
| Assyrians/Chaldeans/Syriacs | 100.0 /100 | #1 | Exceptional 23.8% |
| Immigrants | India | 100.0 /100 | #2 | Exceptional 23.8% |
| Immigrants | Taiwan | 100.0 /100 | #3 | Exceptional 23.9% |
| Filipinos | 100.0 /100 | #4 | Exceptional 24.3% |
| Immigrants | Hong Kong | 100.0 /100 | #5 | Exceptional 24.4% |
| Thais | 100.0 /100 | #6 | Exceptional 24.5% |
| Chinese | 100.0 /100 | #7 | Exceptional 24.6% |
| Immigrants | Iran | 100.0 /100 | #8 | Exceptional 25.1% |
| Immigrants | Lithuania | 100.0 /100 | #9 | Exceptional 25.2% |
| Immigrants | South Central Asia | 100.0 /100 | #10 | Exceptional 25.3% |
| Iranians | 100.0 /100 | #11 | Exceptional 25.5% |
| Bhutanese | 100.0 /100 | #12 | Exceptional 25.6% |
| Indians (Asian) | 100.0 /100 | #13 | Exceptional 25.8% |
| Immigrants | Singapore | 100.0 /100 | #14 | Exceptional 25.8% |
| Immigrants | Ireland | 100.0 /100 | #15 | Exceptional 25.8% |
Demographics Similar to Haitians by Single Mother Poverty
In terms of single mother poverty, the demographic groups most similar to Haitians are Guyanese (29.8%, a difference of 0.050%), Irish (29.8%, a difference of 0.060%), Nicaraguan (29.8%, a difference of 0.090%), Immigrants from Guyana (29.8%, a difference of 0.14%), and Immigrants from Thailand (29.9%, a difference of 0.14%).
| Demographics | Rating | Rank | Single Mother Poverty |
| Swiss | 17.2 /100 | #203 | Poor 29.7% |
| Immigrants | Immigrants | 16.6 /100 | #204 | Poor 29.7% |
| Czechoslovakians | 16.1 /100 | #205 | Poor 29.7% |
| Immigrants | Haiti | 15.8 /100 | #206 | Poor 29.7% |
| Immigrants | Panama | 15.5 /100 | #207 | Poor 29.8% |
| Immigrants | Guyana | 14.7 /100 | #208 | Poor 29.8% |
| Irish | 13.9 /100 | #209 | Poor 29.8% |
| Haitians | 13.3 /100 | #210 | Poor 29.8% |
| Guyanese | 12.8 /100 | #211 | Poor 29.8% |
| Nicaraguans | 12.4 /100 | #212 | Poor 29.8% |
| Immigrants | Thailand | 12.0 /100 | #213 | Poor 29.9% |
| Liberians | 11.7 /100 | #214 | Poor 29.9% |
| Jamaicans | 11.7 /100 | #215 | Poor 29.9% |
| Immigrants | Western Africa | 11.5 /100 | #216 | Poor 29.9% |
| Immigrants | Ghana | 11.3 /100 | #217 | Poor 29.9% |