German vs Immigrants from Sudan Nursery School
COMPARE
German
Immigrants from Sudan
Nursery School
Nursery School Comparison
Germans
Immigrants from Sudan
98.7%
NURSERY SCHOOL
100.0/ 100
METRIC RATING
10th/ 347
METRIC RANK
97.7%
NURSERY SCHOOL
3.9/ 100
METRIC RATING
223rd/ 347
METRIC RANK
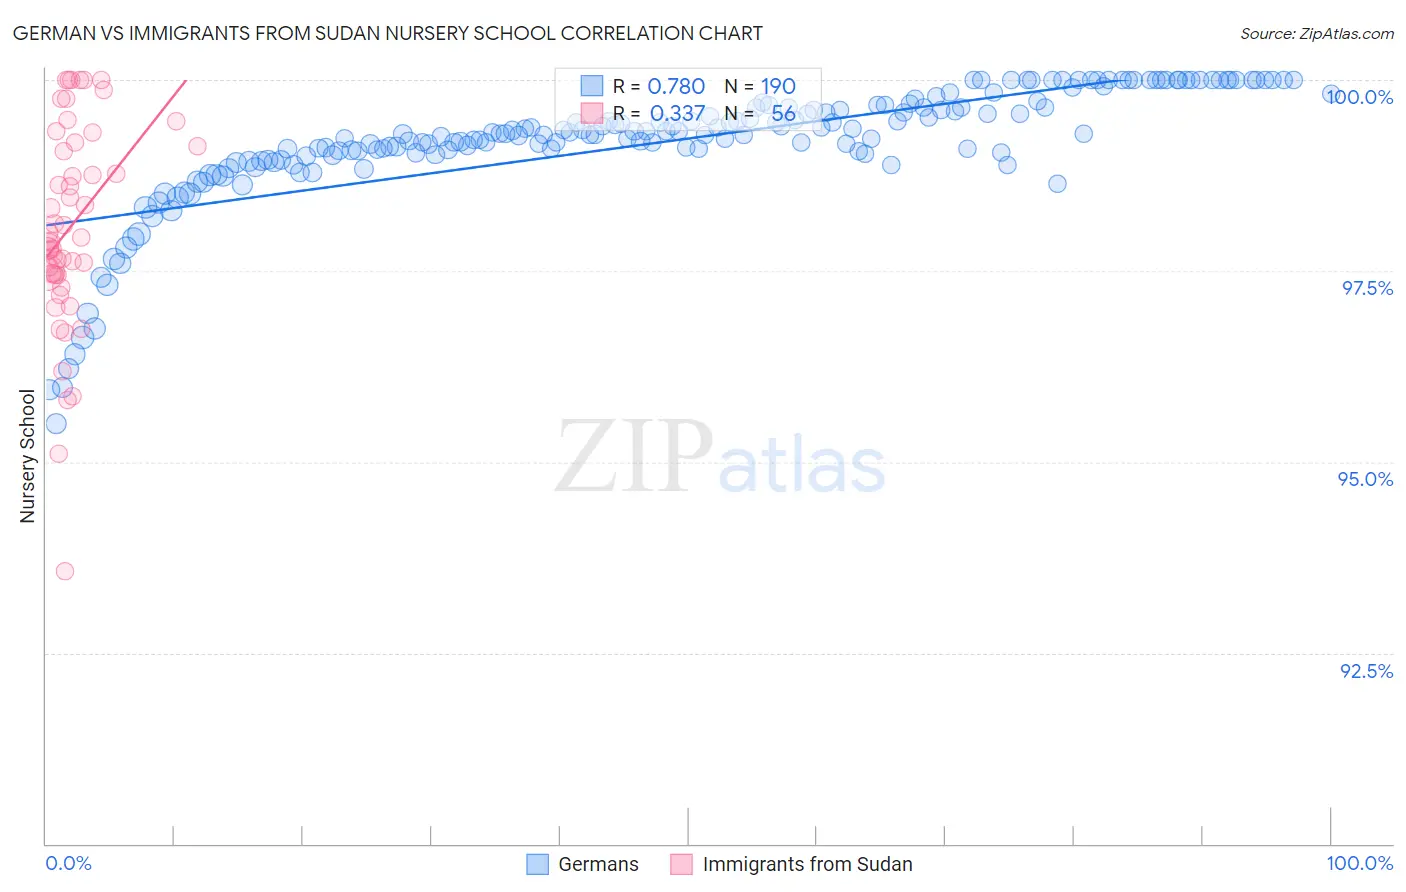
German vs Immigrants from Sudan Nursery School Correlation Chart
The statistical analysis conducted on geographies consisting of 581,302,427 people shows a strong positive correlation between the proportion of Germans and percentage of population with at least nursery school education in the United States with a correlation coefficient (R) of 0.780 and weighted average of 98.7%. Similarly, the statistical analysis conducted on geographies consisting of 118,957,985 people shows a mild positive correlation between the proportion of Immigrants from Sudan and percentage of population with at least nursery school education in the United States with a correlation coefficient (R) of 0.337 and weighted average of 97.7%, a difference of 1.0%.
Nursery School Correlation Summary
| Measurement | German | Immigrants from Sudan |
| Minimum | 95.5% | 93.6% |
| Maximum | 100.0% | 100.0% |
| Range | 4.5% | 6.4% |
| Mean | 99.2% | 98.1% |
| Median | 99.3% | 97.9% |
| Interquartile 25% (IQ1) | 99.0% | 97.5% |
| Interquartile 75% (IQ3) | 99.6% | 99.2% |
| Interquartile Range (IQR) | 0.61% | 1.7% |
| Standard Deviation (Sample) | 0.81% | 1.3% |
| Standard Deviation (Population) | 0.81% | 1.3% |
Similar Demographics by Nursery School
Demographics Similar to Germans by Nursery School
In terms of nursery school, the demographic groups most similar to Germans are Slovak (98.7%, a difference of 0.0%), Tlingit-Haida (98.7%, a difference of 0.0%), Norwegian (98.7%, a difference of 0.020%), Slovene (98.7%, a difference of 0.020%), and Alaska Native (98.8%, a difference of 0.040%).
| Demographics | Rating | Rank | Nursery School |
| Welsh | 100.0 /100 | #3 | Exceptional 98.9% |
| Inupiat | 100.0 /100 | #4 | Exceptional 98.9% |
| Tsimshian | 100.0 /100 | #5 | Exceptional 98.9% |
| Alaskan Athabascans | 100.0 /100 | #6 | Exceptional 98.8% |
| Alaska Natives | 100.0 /100 | #7 | Exceptional 98.8% |
| Norwegians | 100.0 /100 | #8 | Exceptional 98.7% |
| Slovaks | 100.0 /100 | #9 | Exceptional 98.7% |
| Germans | 100.0 /100 | #10 | Exceptional 98.7% |
| Tlingit-Haida | 100.0 /100 | #11 | Exceptional 98.7% |
| Slovenes | 100.0 /100 | #12 | Exceptional 98.7% |
| English | 100.0 /100 | #13 | Exceptional 98.7% |
| Carpatho Rusyns | 100.0 /100 | #14 | Exceptional 98.7% |
| Swedes | 100.0 /100 | #15 | Exceptional 98.7% |
| Scottish | 100.0 /100 | #16 | Exceptional 98.7% |
| Aleuts | 100.0 /100 | #17 | Exceptional 98.7% |
Demographics Similar to Immigrants from Sudan by Nursery School
In terms of nursery school, the demographic groups most similar to Immigrants from Sudan are Immigrants from Syria (97.7%, a difference of 0.0%), Immigrants from Zaire (97.8%, a difference of 0.010%), Tongan (97.8%, a difference of 0.010%), Immigrants from Nepal (97.7%, a difference of 0.010%), and Immigrants from Costa Rica (97.7%, a difference of 0.010%).
| Demographics | Rating | Rank | Nursery School |
| Uruguayans | 7.1 /100 | #216 | Tragic 97.8% |
| Samoans | 6.3 /100 | #217 | Tragic 97.8% |
| Immigrants | Panama | 5.3 /100 | #218 | Tragic 97.8% |
| Immigrants | Morocco | 5.1 /100 | #219 | Tragic 97.8% |
| Immigrants | Zaire | 4.4 /100 | #220 | Tragic 97.8% |
| Tongans | 4.3 /100 | #221 | Tragic 97.8% |
| Immigrants | Syria | 4.0 /100 | #222 | Tragic 97.7% |
| Immigrants | Sudan | 3.9 /100 | #223 | Tragic 97.7% |
| Immigrants | Nepal | 3.6 /100 | #224 | Tragic 97.7% |
| Immigrants | Costa Rica | 3.5 /100 | #225 | Tragic 97.7% |
| Iraqis | 3.5 /100 | #226 | Tragic 97.7% |
| Sub-Saharan Africans | 3.2 /100 | #227 | Tragic 97.7% |
| Sudanese | 3.2 /100 | #228 | Tragic 97.7% |
| Senegalese | 3.2 /100 | #229 | Tragic 97.7% |
| Sierra Leoneans | 2.9 /100 | #230 | Tragic 97.7% |