German vs Cree Single Father Poverty
COMPARE
German
Cree
Single Father Poverty
Single Father Poverty Comparison
Germans
Cree
17.7%
SINGLE FATHER POVERTY
0.0/ 100
METRIC RATING
278th/ 347
METRIC RANK
17.1%
SINGLE FATHER POVERTY
1.0/ 100
METRIC RATING
253rd/ 347
METRIC RANK
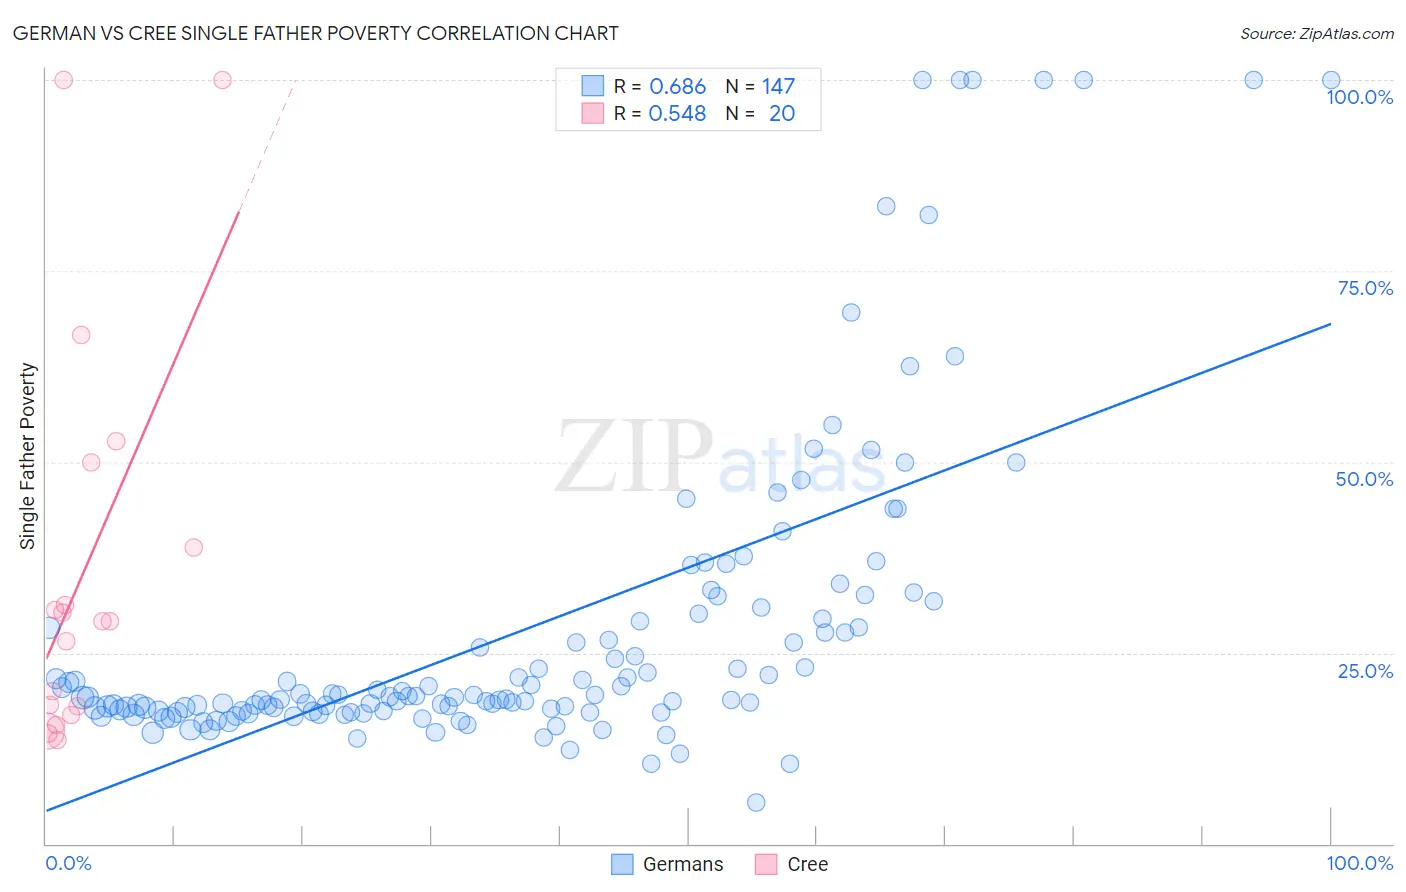
German vs Cree Single Father Poverty Correlation Chart
The statistical analysis conducted on geographies consisting of 412,171,316 people shows a significant positive correlation between the proportion of Germans and poverty level among single fathers in the United States with a correlation coefficient (R) of 0.686 and weighted average of 17.7%. Similarly, the statistical analysis conducted on geographies consisting of 70,905,004 people shows a substantial positive correlation between the proportion of Cree and poverty level among single fathers in the United States with a correlation coefficient (R) of 0.548 and weighted average of 17.1%, a difference of 3.4%.
Single Father Poverty Correlation Summary
| Measurement | German | Cree |
| Minimum | 5.4% | 13.5% |
| Maximum | 100.0% | 100.0% |
| Range | 94.6% | 86.5% |
| Mean | 28.0% | 35.8% |
| Median | 19.2% | 29.2% |
| Interquartile 25% (IQ1) | 17.4% | 17.4% |
| Interquartile 75% (IQ3) | 29.5% | 44.4% |
| Interquartile Range (IQR) | 12.1% | 26.9% |
| Standard Deviation (Sample) | 20.7% | 26.1% |
| Standard Deviation (Population) | 20.6% | 25.5% |
Similar Demographics by Single Father Poverty
Demographics Similar to Germans by Single Father Poverty
In terms of single father poverty, the demographic groups most similar to Germans are Lebanese (17.7%, a difference of 0.010%), Iroquois (17.7%, a difference of 0.15%), German Russian (17.7%, a difference of 0.16%), Scottish (17.7%, a difference of 0.19%), and British West Indian (17.7%, a difference of 0.22%).
| Demographics | Rating | Rank | Single Father Poverty |
| French American Indians | 0.2 /100 | #271 | Tragic 17.4% |
| Barbadians | 0.1 /100 | #272 | Tragic 17.5% |
| Italians | 0.1 /100 | #273 | Tragic 17.5% |
| Macedonians | 0.1 /100 | #274 | Tragic 17.7% |
| British West Indians | 0.0 /100 | #275 | Tragic 17.7% |
| German Russians | 0.0 /100 | #276 | Tragic 17.7% |
| Lebanese | 0.0 /100 | #277 | Tragic 17.7% |
| Germans | 0.0 /100 | #278 | Tragic 17.7% |
| Iroquois | 0.0 /100 | #279 | Tragic 17.7% |
| Scottish | 0.0 /100 | #280 | Tragic 17.7% |
| English | 0.0 /100 | #281 | Tragic 17.8% |
| Dutch | 0.0 /100 | #282 | Tragic 17.8% |
| Alsatians | 0.0 /100 | #283 | Tragic 17.8% |
| Welsh | 0.0 /100 | #284 | Tragic 17.8% |
| Immigrants | Lebanon | 0.0 /100 | #285 | Tragic 17.9% |
Demographics Similar to Cree by Single Father Poverty
In terms of single father poverty, the demographic groups most similar to Cree are Croatian (17.1%, a difference of 0.010%), Austrian (17.1%, a difference of 0.11%), Luxembourger (17.1%, a difference of 0.11%), Immigrants from Honduras (17.1%, a difference of 0.12%), and Canadian (17.1%, a difference of 0.25%).
| Demographics | Rating | Rank | Single Father Poverty |
| Immigrants | Ireland | 1.4 /100 | #246 | Tragic 17.1% |
| Greeks | 1.3 /100 | #247 | Tragic 17.1% |
| Czechoslovakians | 1.3 /100 | #248 | Tragic 17.1% |
| Canadians | 1.3 /100 | #249 | Tragic 17.1% |
| Austrians | 1.1 /100 | #250 | Tragic 17.1% |
| Luxembourgers | 1.1 /100 | #251 | Tragic 17.1% |
| Croatians | 1.0 /100 | #252 | Tragic 17.1% |
| Cree | 1.0 /100 | #253 | Tragic 17.1% |
| Immigrants | Honduras | 0.9 /100 | #254 | Tragic 17.1% |
| Sierra Leoneans | 0.8 /100 | #255 | Tragic 17.2% |
| Immigrants | Haiti | 0.8 /100 | #256 | Tragic 17.2% |
| Immigrants | Albania | 0.7 /100 | #257 | Tragic 17.2% |
| Albanians | 0.7 /100 | #258 | Tragic 17.2% |
| Immigrants | Jamaica | 0.7 /100 | #259 | Tragic 17.2% |
| Spaniards | 0.6 /100 | #260 | Tragic 17.2% |