German vs Latvian Male Poverty
COMPARE
German
Latvian
Male Poverty
Male Poverty Comparison
Germans
Latvians
10.1%
MALE POVERTY
98.3/ 100
METRIC RATING
55th/ 347
METRIC RANK
9.6%
MALE POVERTY
99.7/ 100
METRIC RATING
20th/ 347
METRIC RANK
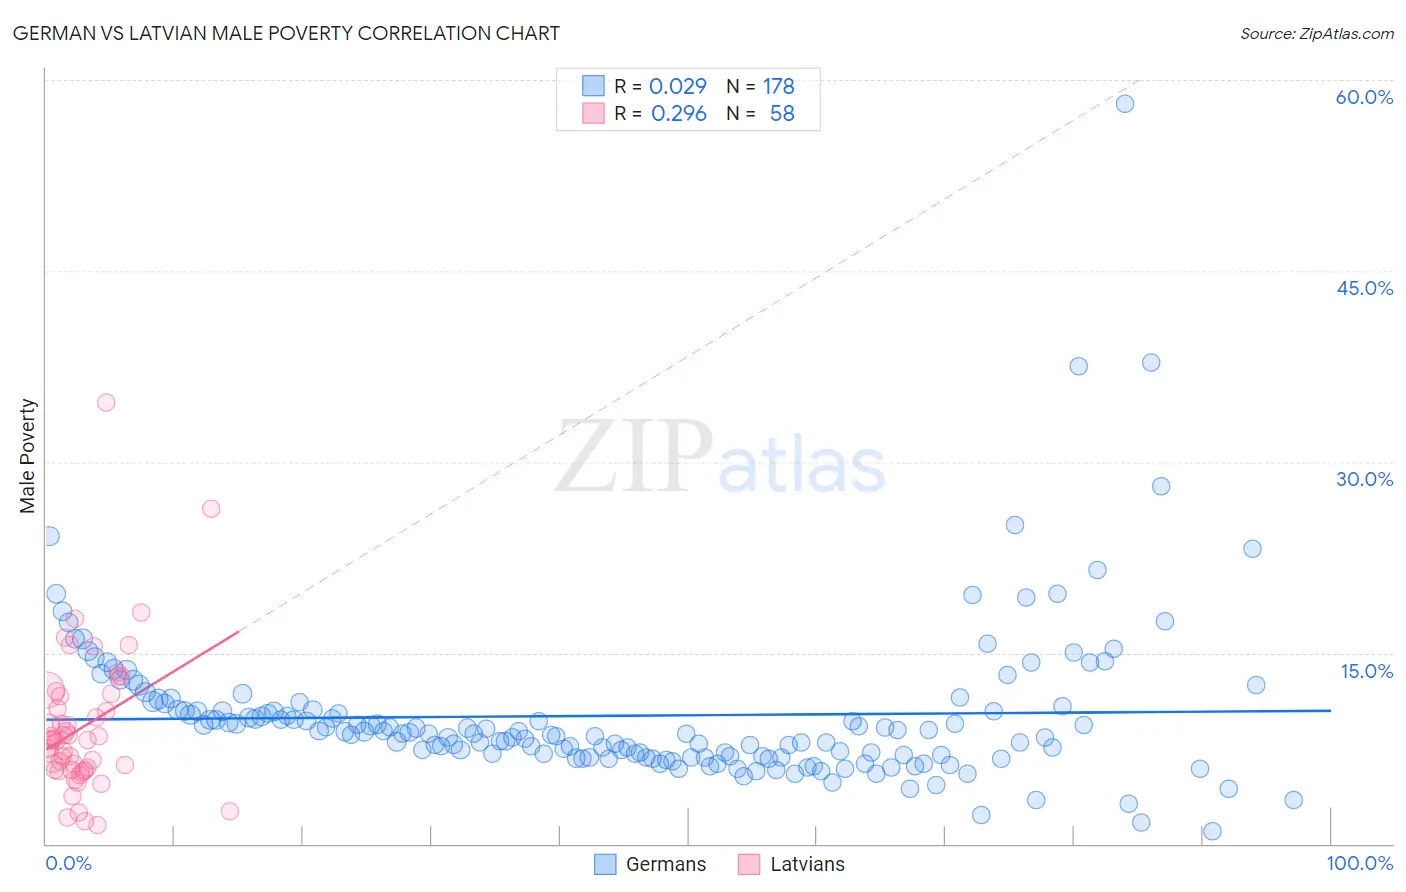
German vs Latvian Male Poverty Correlation Chart
The statistical analysis conducted on geographies consisting of 578,875,550 people shows no correlation between the proportion of Germans and poverty level among males in the United States with a correlation coefficient (R) of 0.029 and weighted average of 10.1%. Similarly, the statistical analysis conducted on geographies consisting of 220,591,162 people shows a weak positive correlation between the proportion of Latvians and poverty level among males in the United States with a correlation coefficient (R) of 0.296 and weighted average of 9.6%, a difference of 5.3%.
Male Poverty Correlation Summary
| Measurement | German | Latvian |
| Minimum | 1.0% | 1.5% |
| Maximum | 58.2% | 34.6% |
| Range | 57.2% | 33.2% |
| Mean | 10.1% | 9.2% |
| Median | 8.7% | 8.1% |
| Interquartile 25% (IQ1) | 6.9% | 5.8% |
| Interquartile 75% (IQ3) | 10.5% | 11.6% |
| Interquartile Range (IQR) | 3.7% | 5.8% |
| Standard Deviation (Sample) | 6.3% | 5.7% |
| Standard Deviation (Population) | 6.3% | 5.7% |
Similar Demographics by Male Poverty
Demographics Similar to Germans by Male Poverty
In terms of male poverty, the demographic groups most similar to Germans are Immigrants from Bulgaria (10.1%, a difference of 0.21%), Immigrants from Austria (10.0%, a difference of 0.29%), Estonian (10.1%, a difference of 0.35%), Scandinavian (10.1%, a difference of 0.42%), and Immigrants from Europe (10.1%, a difference of 0.56%).
| Demographics | Rating | Rank | Male Poverty |
| Immigrants | Japan | 98.8 /100 | #48 | Exceptional 10.0% |
| Slovenes | 98.8 /100 | #49 | Exceptional 10.0% |
| Immigrants | Philippines | 98.7 /100 | #50 | Exceptional 10.0% |
| Immigrants | Croatia | 98.7 /100 | #51 | Exceptional 10.0% |
| Asians | 98.7 /100 | #52 | Exceptional 10.0% |
| Immigrants | Czechoslovakia | 98.6 /100 | #53 | Exceptional 10.0% |
| Immigrants | Austria | 98.5 /100 | #54 | Exceptional 10.0% |
| Germans | 98.3 /100 | #55 | Exceptional 10.1% |
| Immigrants | Bulgaria | 98.2 /100 | #56 | Exceptional 10.1% |
| Estonians | 98.1 /100 | #57 | Exceptional 10.1% |
| Scandinavians | 98.0 /100 | #58 | Exceptional 10.1% |
| Immigrants | Europe | 97.9 /100 | #59 | Exceptional 10.1% |
| Ukrainians | 97.9 /100 | #60 | Exceptional 10.1% |
| Austrians | 97.8 /100 | #61 | Exceptional 10.1% |
| Immigrants | Italy | 97.8 /100 | #62 | Exceptional 10.2% |
Demographics Similar to Latvians by Male Poverty
In terms of male poverty, the demographic groups most similar to Latvians are Immigrants from Hong Kong (9.6%, a difference of 0.10%), Immigrants from Scotland (9.6%, a difference of 0.26%), Lithuanian (9.5%, a difference of 0.28%), Norwegian (9.5%, a difference of 0.45%), and Croatian (9.6%, a difference of 0.51%).
| Demographics | Rating | Rank | Male Poverty |
| Immigrants | Lithuania | 99.9 /100 | #13 | Exceptional 9.4% |
| Immigrants | North Macedonia | 99.8 /100 | #14 | Exceptional 9.4% |
| Bhutanese | 99.8 /100 | #15 | Exceptional 9.5% |
| Luxembourgers | 99.8 /100 | #16 | Exceptional 9.5% |
| Norwegians | 99.8 /100 | #17 | Exceptional 9.5% |
| Lithuanians | 99.8 /100 | #18 | Exceptional 9.5% |
| Immigrants | Hong Kong | 99.7 /100 | #19 | Exceptional 9.6% |
| Latvians | 99.7 /100 | #20 | Exceptional 9.6% |
| Immigrants | Scotland | 99.7 /100 | #21 | Exceptional 9.6% |
| Croatians | 99.7 /100 | #22 | Exceptional 9.6% |
| Italians | 99.7 /100 | #23 | Exceptional 9.6% |
| Swedes | 99.7 /100 | #24 | Exceptional 9.6% |
| Eastern Europeans | 99.6 /100 | #25 | Exceptional 9.6% |
| Burmese | 99.6 /100 | #26 | Exceptional 9.7% |
| Danes | 99.6 /100 | #27 | Exceptional 9.7% |