Venezuelan vs Jordanian Male Poverty
COMPARE
Venezuelan
Jordanian
Male Poverty
Male Poverty Comparison
Venezuelans
Jordanians
11.0%
MALE POVERTY
67.4/ 100
METRIC RATING
151st/ 347
METRIC RANK
10.4%
MALE POVERTY
94.4/ 100
METRIC RATING
92nd/ 347
METRIC RANK
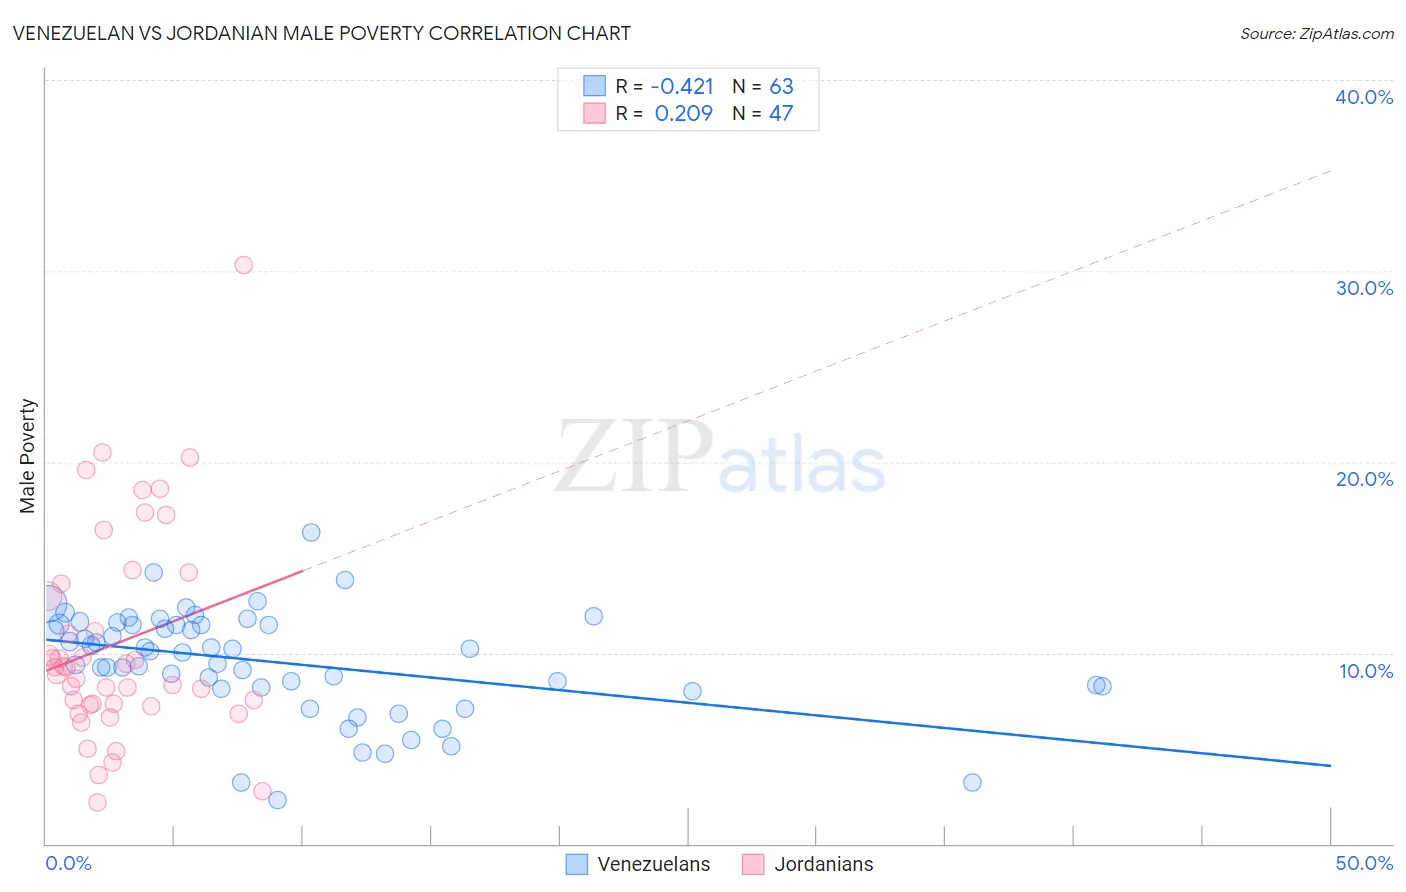
Venezuelan vs Jordanian Male Poverty Correlation Chart
The statistical analysis conducted on geographies consisting of 305,957,955 people shows a moderate negative correlation between the proportion of Venezuelans and poverty level among males in the United States with a correlation coefficient (R) of -0.421 and weighted average of 11.0%. Similarly, the statistical analysis conducted on geographies consisting of 166,386,715 people shows a weak positive correlation between the proportion of Jordanians and poverty level among males in the United States with a correlation coefficient (R) of 0.209 and weighted average of 10.4%, a difference of 5.5%.
Male Poverty Correlation Summary
| Measurement | Venezuelan | Jordanian |
| Minimum | 2.3% | 2.1% |
| Maximum | 16.3% | 30.3% |
| Range | 14.0% | 28.2% |
| Mean | 9.5% | 10.5% |
| Median | 10.1% | 9.2% |
| Interquartile 25% (IQ1) | 8.2% | 7.3% |
| Interquartile 75% (IQ3) | 11.5% | 13.6% |
| Interquartile Range (IQR) | 3.3% | 6.4% |
| Standard Deviation (Sample) | 2.8% | 5.5% |
| Standard Deviation (Population) | 2.7% | 5.5% |
Similar Demographics by Male Poverty
Demographics Similar to Venezuelans by Male Poverty
In terms of male poverty, the demographic groups most similar to Venezuelans are Immigrants from Nepal (11.0%, a difference of 0.0%), Guamanian/Chamorro (11.0%, a difference of 0.020%), Immigrants from Venezuela (11.0%, a difference of 0.060%), Armenian (11.0%, a difference of 0.080%), and Icelander (11.0%, a difference of 0.13%).
| Demographics | Rating | Rank | Male Poverty |
| Samoans | 71.8 /100 | #144 | Good 10.9% |
| Immigrants | Germany | 71.6 /100 | #145 | Good 10.9% |
| Syrians | 71.4 /100 | #146 | Good 10.9% |
| Icelanders | 68.5 /100 | #147 | Good 11.0% |
| Armenians | 68.0 /100 | #148 | Good 11.0% |
| Immigrants | Venezuela | 67.9 /100 | #149 | Good 11.0% |
| Guamanians/Chamorros | 67.6 /100 | #150 | Good 11.0% |
| Venezuelans | 67.4 /100 | #151 | Good 11.0% |
| Immigrants | Nepal | 67.3 /100 | #152 | Good 11.0% |
| Immigrants | Bosnia and Herzegovina | 65.2 /100 | #153 | Good 11.0% |
| Immigrants | Kazakhstan | 64.8 /100 | #154 | Good 11.0% |
| Immigrants | Malaysia | 64.7 /100 | #155 | Good 11.0% |
| Costa Ricans | 63.9 /100 | #156 | Good 11.0% |
| Scotch-Irish | 63.7 /100 | #157 | Good 11.0% |
| Colombians | 63.0 /100 | #158 | Good 11.0% |
Demographics Similar to Jordanians by Male Poverty
In terms of male poverty, the demographic groups most similar to Jordanians are Australian (10.4%, a difference of 0.0%), Immigrants from South Africa (10.4%, a difference of 0.17%), British (10.4%, a difference of 0.20%), Scottish (10.4%, a difference of 0.21%), and Indian (Asian) (10.4%, a difference of 0.27%).
| Demographics | Rating | Rank | Male Poverty |
| Immigrants | England | 95.5 /100 | #85 | Exceptional 10.4% |
| Immigrants | Eastern Asia | 95.3 /100 | #86 | Exceptional 10.4% |
| Northern Europeans | 95.2 /100 | #87 | Exceptional 10.4% |
| Cambodians | 95.0 /100 | #88 | Exceptional 10.4% |
| Immigrants | Denmark | 95.0 /100 | #89 | Exceptional 10.4% |
| Indians (Asian) | 94.9 /100 | #90 | Exceptional 10.4% |
| British | 94.8 /100 | #91 | Exceptional 10.4% |
| Jordanians | 94.4 /100 | #92 | Exceptional 10.4% |
| Australians | 94.4 /100 | #93 | Exceptional 10.4% |
| Immigrants | South Africa | 94.1 /100 | #94 | Exceptional 10.4% |
| Scottish | 94.0 /100 | #95 | Exceptional 10.4% |
| Immigrants | Egypt | 93.7 /100 | #96 | Exceptional 10.4% |
| Romanians | 93.6 /100 | #97 | Exceptional 10.5% |
| Finns | 93.4 /100 | #98 | Exceptional 10.5% |
| Immigrants | Indonesia | 93.3 /100 | #99 | Exceptional 10.5% |