Potawatomi vs Jordanian Male Poverty
COMPARE
Potawatomi
Jordanian
Male Poverty
Male Poverty Comparison
Potawatomi
Jordanians
12.9%
MALE POVERTY
0.2/ 100
METRIC RATING
249th/ 347
METRIC RANK
10.4%
MALE POVERTY
94.4/ 100
METRIC RATING
92nd/ 347
METRIC RANK
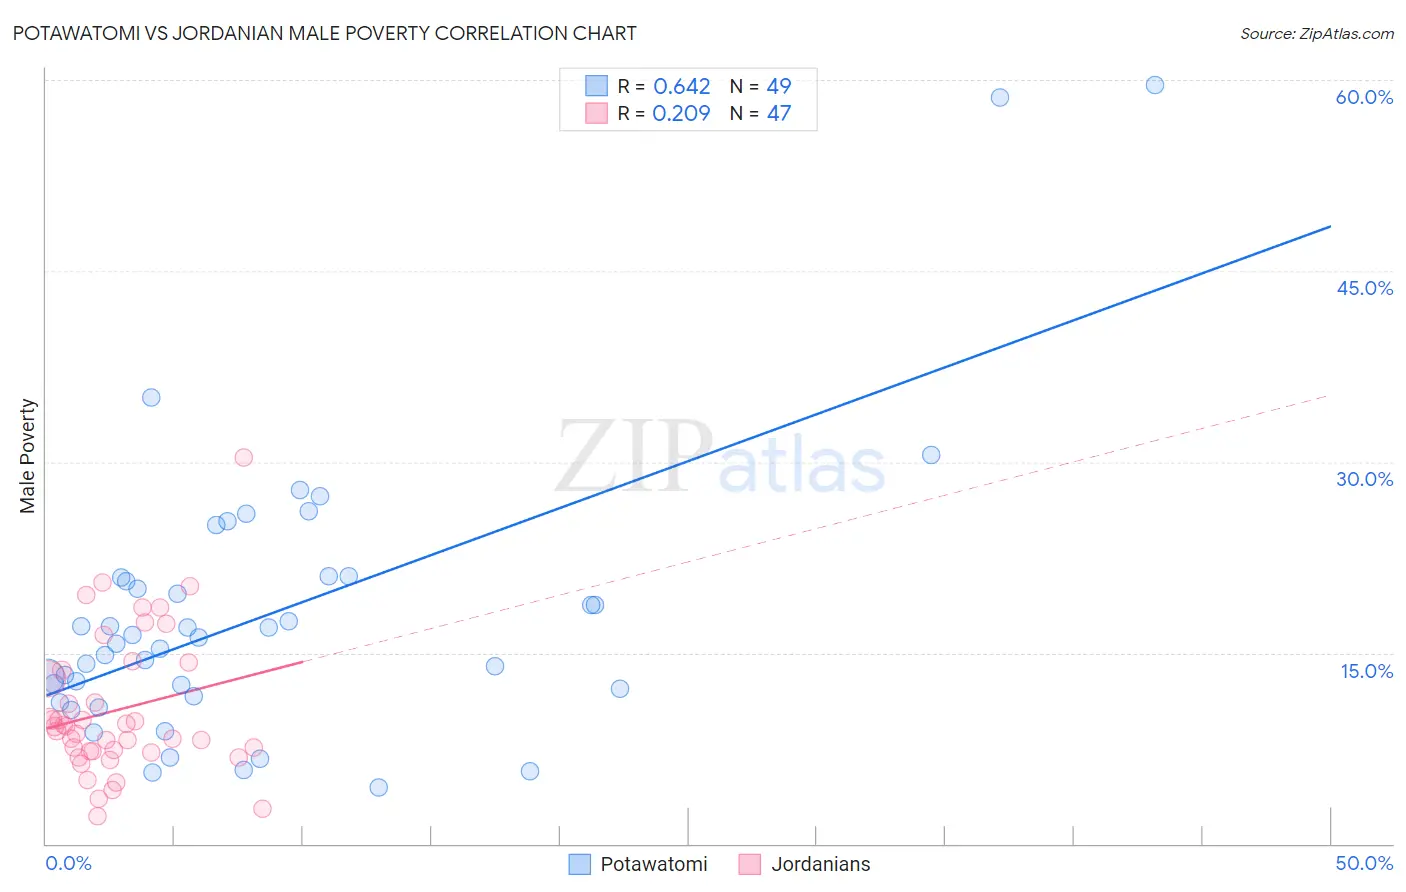
Potawatomi vs Jordanian Male Poverty Correlation Chart
The statistical analysis conducted on geographies consisting of 117,745,310 people shows a significant positive correlation between the proportion of Potawatomi and poverty level among males in the United States with a correlation coefficient (R) of 0.642 and weighted average of 12.9%. Similarly, the statistical analysis conducted on geographies consisting of 166,386,715 people shows a weak positive correlation between the proportion of Jordanians and poverty level among males in the United States with a correlation coefficient (R) of 0.209 and weighted average of 10.4%, a difference of 23.9%.
Male Poverty Correlation Summary
| Measurement | Potawatomi | Jordanian |
| Minimum | 4.4% | 2.1% |
| Maximum | 59.6% | 30.3% |
| Range | 55.1% | 28.2% |
| Mean | 18.0% | 10.5% |
| Median | 16.2% | 9.2% |
| Interquartile 25% (IQ1) | 11.9% | 7.3% |
| Interquartile 75% (IQ3) | 21.0% | 13.6% |
| Interquartile Range (IQR) | 9.1% | 6.4% |
| Standard Deviation (Sample) | 11.0% | 5.5% |
| Standard Deviation (Population) | 10.9% | 5.5% |
Similar Demographics by Male Poverty
Demographics Similar to Potawatomi by Male Poverty
In terms of male poverty, the demographic groups most similar to Potawatomi are Immigrants from Nicaragua (12.9%, a difference of 0.010%), Immigrants from Sudan (12.9%, a difference of 0.070%), Immigrants from Cuba (12.9%, a difference of 0.11%), Immigrants from Western Africa (12.9%, a difference of 0.13%), and Immigrants from Ecuador (12.9%, a difference of 0.14%).
| Demographics | Rating | Rank | Male Poverty |
| Nepalese | 0.3 /100 | #242 | Tragic 12.8% |
| Alaskan Athabascans | 0.3 /100 | #243 | Tragic 12.8% |
| Tsimshian | 0.3 /100 | #244 | Tragic 12.8% |
| Liberians | 0.3 /100 | #245 | Tragic 12.8% |
| Immigrants | El Salvador | 0.2 /100 | #246 | Tragic 12.8% |
| Immigrants | Western Africa | 0.2 /100 | #247 | Tragic 12.9% |
| Immigrants | Sudan | 0.2 /100 | #248 | Tragic 12.9% |
| Potawatomi | 0.2 /100 | #249 | Tragic 12.9% |
| Immigrants | Nicaragua | 0.2 /100 | #250 | Tragic 12.9% |
| Immigrants | Cuba | 0.2 /100 | #251 | Tragic 12.9% |
| Immigrants | Ecuador | 0.2 /100 | #252 | Tragic 12.9% |
| Immigrants | Ghana | 0.2 /100 | #253 | Tragic 12.9% |
| Mexican American Indians | 0.1 /100 | #254 | Tragic 13.0% |
| Immigrants | Liberia | 0.1 /100 | #255 | Tragic 13.0% |
| Immigrants | Burma/Myanmar | 0.1 /100 | #256 | Tragic 13.0% |
Demographics Similar to Jordanians by Male Poverty
In terms of male poverty, the demographic groups most similar to Jordanians are Australian (10.4%, a difference of 0.0%), Immigrants from South Africa (10.4%, a difference of 0.17%), British (10.4%, a difference of 0.20%), Scottish (10.4%, a difference of 0.21%), and Indian (Asian) (10.4%, a difference of 0.27%).
| Demographics | Rating | Rank | Male Poverty |
| Immigrants | England | 95.5 /100 | #85 | Exceptional 10.4% |
| Immigrants | Eastern Asia | 95.3 /100 | #86 | Exceptional 10.4% |
| Northern Europeans | 95.2 /100 | #87 | Exceptional 10.4% |
| Cambodians | 95.0 /100 | #88 | Exceptional 10.4% |
| Immigrants | Denmark | 95.0 /100 | #89 | Exceptional 10.4% |
| Indians (Asian) | 94.9 /100 | #90 | Exceptional 10.4% |
| British | 94.8 /100 | #91 | Exceptional 10.4% |
| Jordanians | 94.4 /100 | #92 | Exceptional 10.4% |
| Australians | 94.4 /100 | #93 | Exceptional 10.4% |
| Immigrants | South Africa | 94.1 /100 | #94 | Exceptional 10.4% |
| Scottish | 94.0 /100 | #95 | Exceptional 10.4% |
| Immigrants | Egypt | 93.7 /100 | #96 | Exceptional 10.4% |
| Romanians | 93.6 /100 | #97 | Exceptional 10.5% |
| Finns | 93.4 /100 | #98 | Exceptional 10.5% |
| Immigrants | Indonesia | 93.3 /100 | #99 | Exceptional 10.5% |