German Russian vs Jordanian Median Household Income
COMPARE
German Russian
Jordanian
Median Household Income
Median Household Income Comparison
German Russians
Jordanians
$75,856
MEDIAN HOUSEHOLD INCOME
0.3/ 100
METRIC RATING
267th/ 347
METRIC RANK
$91,794
MEDIAN HOUSEHOLD INCOME
98.7/ 100
METRIC RATING
96th/ 347
METRIC RANK
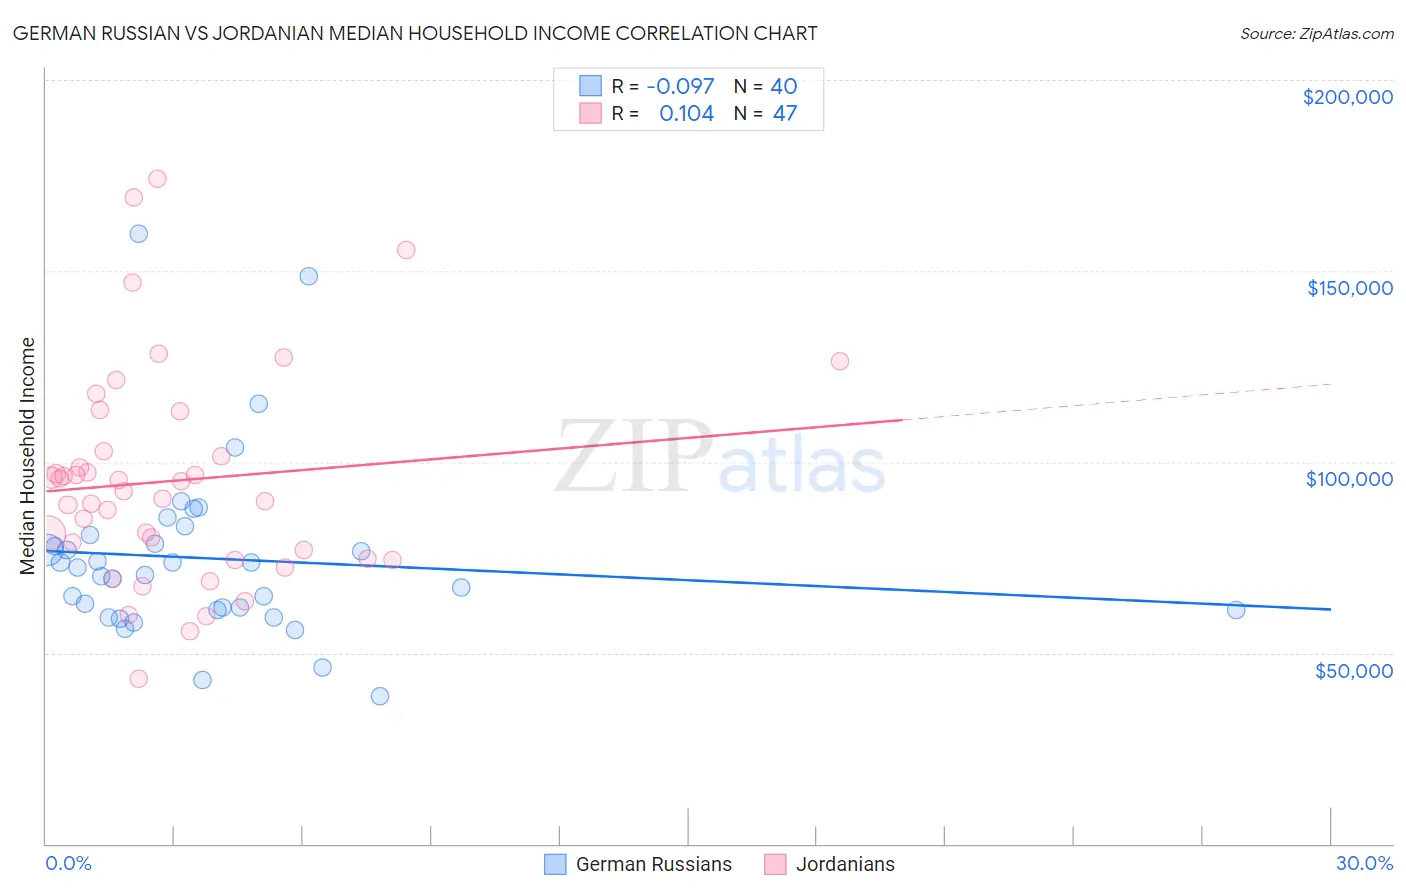
German Russian vs Jordanian Median Household Income Correlation Chart
The statistical analysis conducted on geographies consisting of 96,440,966 people shows a slight negative correlation between the proportion of German Russians and median household income in the United States with a correlation coefficient (R) of -0.097 and weighted average of $75,856. Similarly, the statistical analysis conducted on geographies consisting of 166,374,087 people shows a poor positive correlation between the proportion of Jordanians and median household income in the United States with a correlation coefficient (R) of 0.104 and weighted average of $91,794, a difference of 21.0%.
Median Household Income Correlation Summary
| Measurement | German Russian | Jordanian |
| Minimum | $38,750 | $43,214 |
| Maximum | $159,827 | $174,260 |
| Range | $121,077 | $131,046 |
| Mean | $74,697 | $95,049 |
| Median | $71,396 | $92,429 |
| Interquartile 25% (IQ1) | $61,250 | $74,643 |
| Interquartile 75% (IQ3) | $79,678 | $102,895 |
| Interquartile Range (IQR) | $18,428 | $28,252 |
| Standard Deviation (Sample) | $23,757 | $28,123 |
| Standard Deviation (Population) | $23,458 | $27,822 |
Similar Demographics by Median Household Income
Demographics Similar to German Russians by Median Household Income
In terms of median household income, the demographic groups most similar to German Russians are Immigrants from Jamaica ($75,851, a difference of 0.010%), Cape Verdean ($75,848, a difference of 0.010%), Hmong ($75,839, a difference of 0.020%), Pennsylvania German ($75,814, a difference of 0.060%), and American ($75,932, a difference of 0.10%).
| Demographics | Rating | Rank | Median Household Income |
| Jamaicans | 0.4 /100 | #260 | Tragic $76,583 |
| Immigrants | Grenada | 0.4 /100 | #261 | Tragic $76,517 |
| French American Indians | 0.4 /100 | #262 | Tragic $76,387 |
| Alaskan Athabascans | 0.4 /100 | #263 | Tragic $76,383 |
| Guatemalans | 0.3 /100 | #264 | Tragic $75,961 |
| Immigrants | Belize | 0.3 /100 | #265 | Tragic $75,938 |
| Americans | 0.3 /100 | #266 | Tragic $75,932 |
| German Russians | 0.3 /100 | #267 | Tragic $75,856 |
| Immigrants | Jamaica | 0.3 /100 | #268 | Tragic $75,851 |
| Cape Verdeans | 0.3 /100 | #269 | Tragic $75,848 |
| Hmong | 0.3 /100 | #270 | Tragic $75,839 |
| Pennsylvania Germans | 0.3 /100 | #271 | Tragic $75,814 |
| Somalis | 0.3 /100 | #272 | Tragic $75,782 |
| Liberians | 0.2 /100 | #273 | Tragic $75,667 |
| British West Indians | 0.2 /100 | #274 | Tragic $75,647 |
Demographics Similar to Jordanians by Median Household Income
In terms of median household income, the demographic groups most similar to Jordanians are Armenian ($91,807, a difference of 0.010%), Immigrants from North America ($91,860, a difference of 0.070%), Immigrants from Serbia ($91,730, a difference of 0.070%), Immigrants from Lebanon ($91,887, a difference of 0.10%), and Immigrants from Western Europe ($91,936, a difference of 0.15%).
| Demographics | Rating | Rank | Median Household Income |
| Romanians | 98.8 /100 | #89 | Exceptional $91,994 |
| Assyrians/Chaldeans/Syriacs | 98.8 /100 | #90 | Exceptional $91,991 |
| Immigrants | Vietnam | 98.8 /100 | #91 | Exceptional $91,987 |
| Immigrants | Western Europe | 98.8 /100 | #92 | Exceptional $91,936 |
| Immigrants | Lebanon | 98.7 /100 | #93 | Exceptional $91,887 |
| Immigrants | North America | 98.7 /100 | #94 | Exceptional $91,860 |
| Armenians | 98.7 /100 | #95 | Exceptional $91,807 |
| Jordanians | 98.7 /100 | #96 | Exceptional $91,794 |
| Immigrants | Serbia | 98.6 /100 | #97 | Exceptional $91,730 |
| Immigrants | Southern Europe | 98.5 /100 | #98 | Exceptional $91,605 |
| Immigrants | South Eastern Asia | 98.4 /100 | #99 | Exceptional $91,541 |
| Ukrainians | 98.3 /100 | #100 | Exceptional $91,456 |
| Immigrants | Moldova | 98.3 /100 | #101 | Exceptional $91,446 |
| Austrians | 98.2 /100 | #102 | Exceptional $91,339 |
| Immigrants | Ukraine | 98.0 /100 | #103 | Exceptional $91,124 |