German Russian vs Immigrants from South Africa Associate's Degree
COMPARE
German Russian
Immigrants from South Africa
Associate's Degree
Associate's Degree Comparison
German Russians
Immigrants from South Africa
45.1%
ASSOCIATE'S DEGREE
18.9/ 100
METRIC RATING
206th/ 347
METRIC RANK
52.5%
ASSOCIATE'S DEGREE
99.9/ 100
METRIC RATING
43rd/ 347
METRIC RANK
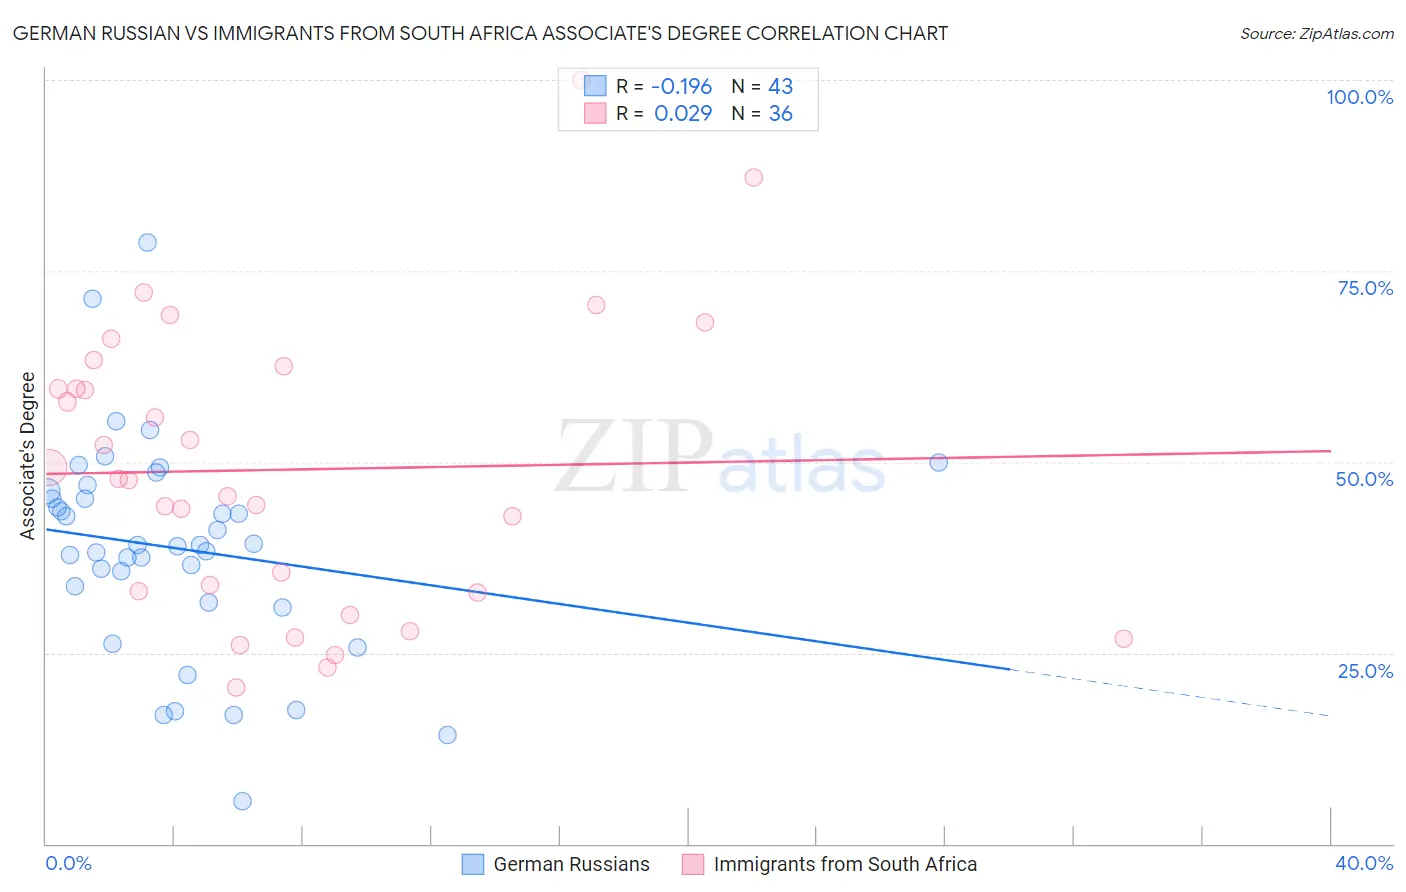
German Russian vs Immigrants from South Africa Associate's Degree Correlation Chart
The statistical analysis conducted on geographies consisting of 96,460,905 people shows a poor negative correlation between the proportion of German Russians and percentage of population with at least associate's degree education in the United States with a correlation coefficient (R) of -0.196 and weighted average of 45.1%. Similarly, the statistical analysis conducted on geographies consisting of 233,315,008 people shows no correlation between the proportion of Immigrants from South Africa and percentage of population with at least associate's degree education in the United States with a correlation coefficient (R) of 0.029 and weighted average of 52.5%, a difference of 16.5%.
Associate's Degree Correlation Summary
| Measurement | German Russian | Immigrants from South Africa |
| Minimum | 5.6% | 20.4% |
| Maximum | 78.7% | 100.0% |
| Range | 73.1% | 79.6% |
| Mean | 38.6% | 49.0% |
| Median | 39.1% | 47.7% |
| Interquartile 25% (IQ1) | 31.5% | 32.9% |
| Interquartile 75% (IQ3) | 46.2% | 61.1% |
| Interquartile Range (IQR) | 14.6% | 28.1% |
| Standard Deviation (Sample) | 14.2% | 18.9% |
| Standard Deviation (Population) | 14.0% | 18.6% |
Similar Demographics by Associate's Degree
Demographics Similar to German Russians by Associate's Degree
In terms of associate's degree, the demographic groups most similar to German Russians are Immigrants from Thailand (45.1%, a difference of 0.0%), Nigerian (45.1%, a difference of 0.030%), Panamanian (45.1%, a difference of 0.070%), Immigrants from South Eastern Asia (45.2%, a difference of 0.17%), and Dutch (45.0%, a difference of 0.17%).
| Demographics | Rating | Rank | Associate's Degree |
| Immigrants | Senegal | 21.2 /100 | #199 | Fair 45.2% |
| Senegalese | 21.1 /100 | #200 | Fair 45.2% |
| Immigrants | Vietnam | 20.8 /100 | #201 | Fair 45.2% |
| Spaniards | 20.4 /100 | #202 | Fair 45.2% |
| Immigrants | South Eastern Asia | 20.2 /100 | #203 | Fair 45.2% |
| Nigerians | 19.1 /100 | #204 | Poor 45.1% |
| Immigrants | Thailand | 18.9 /100 | #205 | Poor 45.1% |
| German Russians | 18.9 /100 | #206 | Poor 45.1% |
| Panamanians | 18.4 /100 | #207 | Poor 45.1% |
| Dutch | 17.6 /100 | #208 | Poor 45.0% |
| Immigrants | Costa Rica | 16.7 /100 | #209 | Poor 45.0% |
| Immigrants | Philippines | 16.7 /100 | #210 | Poor 45.0% |
| Immigrants | Zaire | 16.6 /100 | #211 | Poor 45.0% |
| French Canadians | 15.0 /100 | #212 | Poor 44.9% |
| Immigrants | Ghana | 14.2 /100 | #213 | Poor 44.8% |
Demographics Similar to Immigrants from South Africa by Associate's Degree
In terms of associate's degree, the demographic groups most similar to Immigrants from South Africa are Immigrants from Malaysia (52.5%, a difference of 0.010%), Immigrants from Saudi Arabia (52.6%, a difference of 0.040%), Estonian (52.5%, a difference of 0.090%), Immigrants from Lithuania (52.4%, a difference of 0.16%), and Immigrants from Bulgaria (52.4%, a difference of 0.30%).
| Demographics | Rating | Rank | Associate's Degree |
| Immigrants | Russia | 100.0 /100 | #36 | Exceptional 53.1% |
| Immigrants | Denmark | 100.0 /100 | #37 | Exceptional 53.1% |
| Mongolians | 100.0 /100 | #38 | Exceptional 53.0% |
| Immigrants | Belarus | 99.9 /100 | #39 | Exceptional 52.8% |
| Immigrants | Latvia | 99.9 /100 | #40 | Exceptional 52.8% |
| Immigrants | Saudi Arabia | 99.9 /100 | #41 | Exceptional 52.6% |
| Immigrants | Malaysia | 99.9 /100 | #42 | Exceptional 52.5% |
| Immigrants | South Africa | 99.9 /100 | #43 | Exceptional 52.5% |
| Estonians | 99.9 /100 | #44 | Exceptional 52.5% |
| Immigrants | Lithuania | 99.9 /100 | #45 | Exceptional 52.4% |
| Immigrants | Bulgaria | 99.9 /100 | #46 | Exceptional 52.4% |
| Immigrants | Kuwait | 99.9 /100 | #47 | Exceptional 52.4% |
| Immigrants | Norway | 99.9 /100 | #48 | Exceptional 52.2% |
| Immigrants | Austria | 99.9 /100 | #49 | Exceptional 52.1% |
| Asians | 99.9 /100 | #50 | Exceptional 52.1% |