German Russian vs Immigrants from the Azores Female Poverty
COMPARE
German Russian
Immigrants from the Azores
Female Poverty
Female Poverty Comparison
German Russians
Immigrants from the Azores
14.7%
FEMALE POVERTY
2.0/ 100
METRIC RATING
228th/ 347
METRIC RANK
14.2%
FEMALE POVERTY
7.9/ 100
METRIC RATING
208th/ 347
METRIC RANK
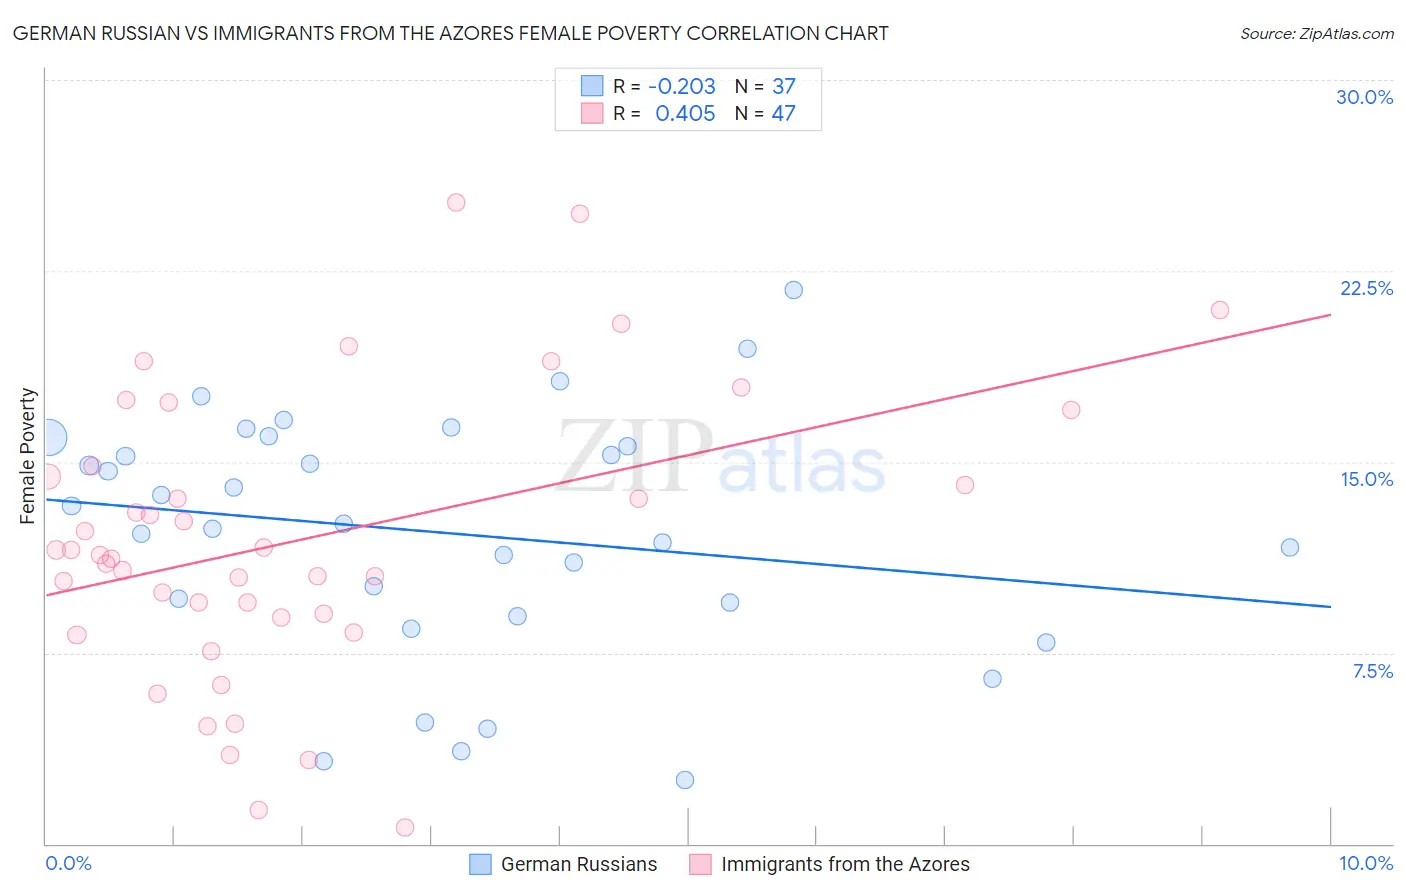
German Russian vs Immigrants from the Azores Female Poverty Correlation Chart
The statistical analysis conducted on geographies consisting of 96,439,432 people shows a weak negative correlation between the proportion of German Russians and poverty level among females in the United States with a correlation coefficient (R) of -0.203 and weighted average of 14.7%. Similarly, the statistical analysis conducted on geographies consisting of 46,244,959 people shows a moderate positive correlation between the proportion of Immigrants from the Azores and poverty level among females in the United States with a correlation coefficient (R) of 0.405 and weighted average of 14.2%, a difference of 3.3%.
Female Poverty Correlation Summary
| Measurement | German Russian | Immigrants from the Azores |
| Minimum | 2.5% | 0.65% |
| Maximum | 21.7% | 25.2% |
| Range | 19.2% | 24.5% |
| Mean | 12.2% | 12.0% |
| Median | 12.6% | 11.3% |
| Interquartile 25% (IQ1) | 9.2% | 8.9% |
| Interquartile 75% (IQ3) | 15.8% | 14.8% |
| Interquartile Range (IQR) | 6.6% | 5.9% |
| Standard Deviation (Sample) | 4.7% | 5.6% |
| Standard Deviation (Population) | 4.7% | 5.6% |
Demographics Similar to German Russians and Immigrants from the Azores by Female Poverty
In terms of female poverty, the demographic groups most similar to German Russians are Immigrants from Nigeria (14.7%, a difference of 0.15%), Immigrants from Eritrea (14.6%, a difference of 0.45%), Immigrants from Micronesia (14.6%, a difference of 0.78%), American (14.6%, a difference of 0.79%), and Immigrants from Africa (14.5%, a difference of 1.2%). Similarly, the demographic groups most similar to Immigrants from the Azores are Panamanian (14.2%, a difference of 0.060%), Malaysian (14.3%, a difference of 0.15%), Moroccan (14.3%, a difference of 0.23%), Bermudan (14.4%, a difference of 0.86%), and Alaskan Athabascan (14.4%, a difference of 0.95%).
| Demographics | Rating | Rank | Female Poverty |
| Immigrants | Azores | 7.9 /100 | #208 | Tragic 14.2% |
| Panamanians | 7.7 /100 | #209 | Tragic 14.2% |
| Malaysians | 7.4 /100 | #210 | Tragic 14.3% |
| Moroccans | 7.2 /100 | #211 | Tragic 14.3% |
| Bermudans | 5.5 /100 | #212 | Tragic 14.4% |
| Alaskan Athabascans | 5.3 /100 | #213 | Tragic 14.4% |
| Marshallese | 5.0 /100 | #214 | Tragic 14.4% |
| Immigrants | Panama | 4.7 /100 | #215 | Tragic 14.4% |
| Immigrants | Thailand | 4.5 /100 | #216 | Tragic 14.4% |
| Immigrants | Immigrants | 4.5 /100 | #217 | Tragic 14.4% |
| Immigrants | Uzbekistan | 4.4 /100 | #218 | Tragic 14.4% |
| Japanese | 4.1 /100 | #219 | Tragic 14.5% |
| Alsatians | 4.0 /100 | #220 | Tragic 14.5% |
| Immigrants | Cambodia | 3.7 /100 | #221 | Tragic 14.5% |
| Immigrants | Nonimmigrants | 3.7 /100 | #222 | Tragic 14.5% |
| Immigrants | Africa | 3.3 /100 | #223 | Tragic 14.5% |
| Americans | 2.8 /100 | #224 | Tragic 14.6% |
| Immigrants | Micronesia | 2.8 /100 | #225 | Tragic 14.6% |
| Immigrants | Eritrea | 2.4 /100 | #226 | Tragic 14.6% |
| Immigrants | Nigeria | 2.1 /100 | #227 | Tragic 14.7% |
| German Russians | 2.0 /100 | #228 | Tragic 14.7% |