German Russian vs Bangladeshi Female Poverty
COMPARE
German Russian
Bangladeshi
Female Poverty
Female Poverty Comparison
German Russians
Bangladeshis
14.7%
FEMALE POVERTY
2.0/ 100
METRIC RATING
228th/ 347
METRIC RANK
16.0%
FEMALE POVERTY
0.0/ 100
METRIC RATING
277th/ 347
METRIC RANK
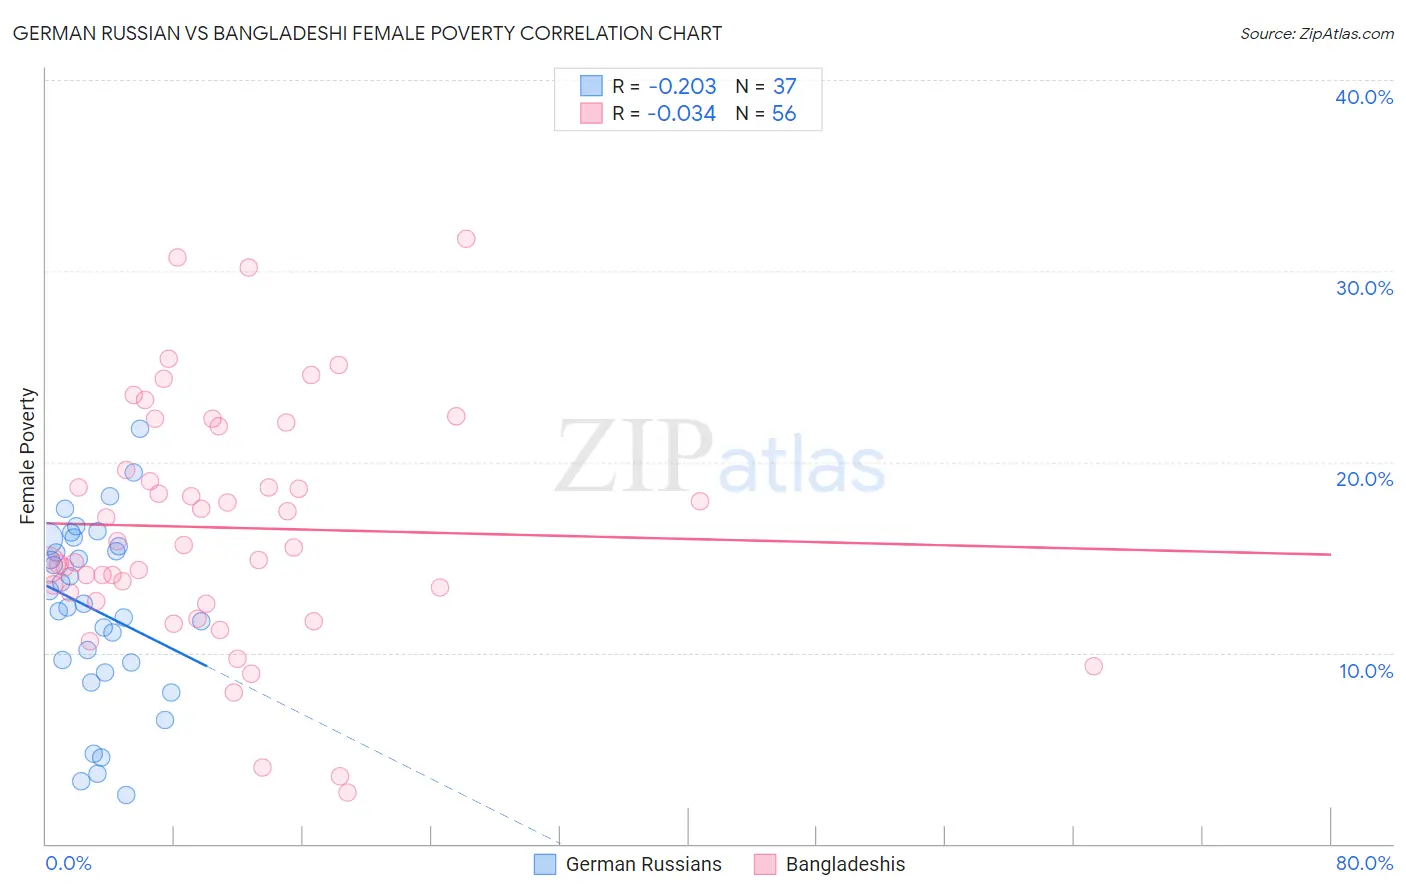
German Russian vs Bangladeshi Female Poverty Correlation Chart
The statistical analysis conducted on geographies consisting of 96,439,432 people shows a weak negative correlation between the proportion of German Russians and poverty level among females in the United States with a correlation coefficient (R) of -0.203 and weighted average of 14.7%. Similarly, the statistical analysis conducted on geographies consisting of 141,353,886 people shows no correlation between the proportion of Bangladeshis and poverty level among females in the United States with a correlation coefficient (R) of -0.034 and weighted average of 16.0%, a difference of 8.8%.
Female Poverty Correlation Summary
| Measurement | German Russian | Bangladeshi |
| Minimum | 2.5% | 2.7% |
| Maximum | 21.7% | 31.7% |
| Range | 19.2% | 29.0% |
| Mean | 12.2% | 16.6% |
| Median | 12.6% | 15.6% |
| Interquartile 25% (IQ1) | 9.2% | 12.9% |
| Interquartile 75% (IQ3) | 15.8% | 20.7% |
| Interquartile Range (IQR) | 6.6% | 7.8% |
| Standard Deviation (Sample) | 4.7% | 6.3% |
| Standard Deviation (Population) | 4.7% | 6.2% |
Similar Demographics by Female Poverty
Demographics Similar to German Russians by Female Poverty
In terms of female poverty, the demographic groups most similar to German Russians are Ghanaian (14.7%, a difference of 0.060%), Immigrants from Nigeria (14.7%, a difference of 0.15%), Alaska Native (14.7%, a difference of 0.27%), Nigerian (14.8%, a difference of 0.36%), and Immigrants from Eritrea (14.6%, a difference of 0.45%).
| Demographics | Rating | Rank | Female Poverty |
| Immigrants | Cambodia | 3.7 /100 | #221 | Tragic 14.5% |
| Immigrants | Nonimmigrants | 3.7 /100 | #222 | Tragic 14.5% |
| Immigrants | Africa | 3.3 /100 | #223 | Tragic 14.5% |
| Americans | 2.8 /100 | #224 | Tragic 14.6% |
| Immigrants | Micronesia | 2.8 /100 | #225 | Tragic 14.6% |
| Immigrants | Eritrea | 2.4 /100 | #226 | Tragic 14.6% |
| Immigrants | Nigeria | 2.1 /100 | #227 | Tragic 14.7% |
| German Russians | 2.0 /100 | #228 | Tragic 14.7% |
| Ghanaians | 1.9 /100 | #229 | Tragic 14.7% |
| Alaska Natives | 1.8 /100 | #230 | Tragic 14.7% |
| Nigerians | 1.7 /100 | #231 | Tragic 14.8% |
| Osage | 1.5 /100 | #232 | Tragic 14.8% |
| Immigrants | Saudi Arabia | 1.4 /100 | #233 | Tragic 14.8% |
| Fijians | 1.1 /100 | #234 | Tragic 14.9% |
| Immigrants | Laos | 0.9 /100 | #235 | Tragic 15.0% |
Demographics Similar to Bangladeshis by Female Poverty
In terms of female poverty, the demographic groups most similar to Bangladeshis are Central American (16.0%, a difference of 0.19%), Immigrants from Barbados (16.0%, a difference of 0.31%), Immigrants from West Indies (16.1%, a difference of 0.31%), Haitian (15.9%, a difference of 0.38%), and Barbadian (15.9%, a difference of 0.38%).
| Demographics | Rating | Rank | Female Poverty |
| Chickasaw | 0.1 /100 | #270 | Tragic 15.9% |
| Immigrants | St. Vincent and the Grenadines | 0.0 /100 | #271 | Tragic 15.9% |
| Belizeans | 0.0 /100 | #272 | Tragic 15.9% |
| Haitians | 0.0 /100 | #273 | Tragic 15.9% |
| Barbadians | 0.0 /100 | #274 | Tragic 15.9% |
| Immigrants | Barbados | 0.0 /100 | #275 | Tragic 16.0% |
| Central Americans | 0.0 /100 | #276 | Tragic 16.0% |
| Bangladeshis | 0.0 /100 | #277 | Tragic 16.0% |
| Immigrants | West Indies | 0.0 /100 | #278 | Tragic 16.1% |
| Immigrants | Bahamas | 0.0 /100 | #279 | Tragic 16.1% |
| Vietnamese | 0.0 /100 | #280 | Tragic 16.1% |
| West Indians | 0.0 /100 | #281 | Tragic 16.1% |
| Immigrants | Haiti | 0.0 /100 | #282 | Tragic 16.1% |
| Immigrants | Cuba | 0.0 /100 | #283 | Tragic 16.1% |
| Spanish Americans | 0.0 /100 | #284 | Tragic 16.2% |