Finnish vs Zimbabwean Single Mother Poverty
COMPARE
Finnish
Zimbabwean
Single Mother Poverty
Single Mother Poverty Comparison
Finns
Zimbabweans
30.0%
SINGLE MOTHER POVERTY
9.3/ 100
METRIC RATING
219th/ 347
METRIC RANK
27.9%
SINGLE MOTHER POVERTY
97.1/ 100
METRIC RATING
100th/ 347
METRIC RANK
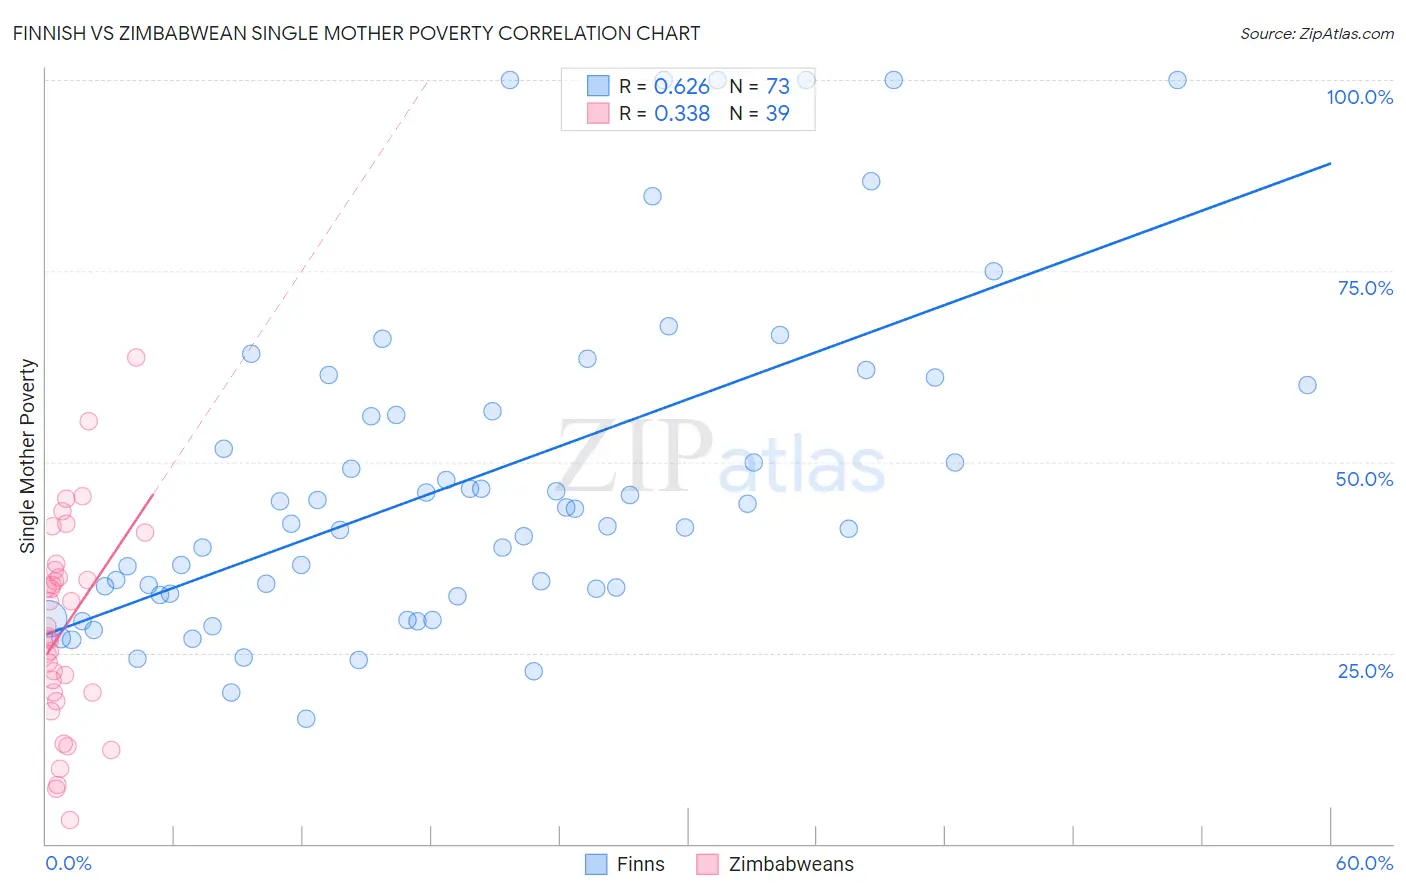
Finnish vs Zimbabwean Single Mother Poverty Correlation Chart
The statistical analysis conducted on geographies consisting of 392,432,308 people shows a significant positive correlation between the proportion of Finns and poverty level among single mothers in the United States with a correlation coefficient (R) of 0.626 and weighted average of 30.0%. Similarly, the statistical analysis conducted on geographies consisting of 68,932,281 people shows a mild positive correlation between the proportion of Zimbabweans and poverty level among single mothers in the United States with a correlation coefficient (R) of 0.338 and weighted average of 27.9%, a difference of 7.2%.
Single Mother Poverty Correlation Summary
| Measurement | Finnish | Zimbabwean |
| Minimum | 16.4% | 3.1% |
| Maximum | 100.0% | 63.7% |
| Range | 83.6% | 60.6% |
| Mean | 47.6% | 28.4% |
| Median | 42.0% | 27.1% |
| Interquartile 25% (IQ1) | 32.7% | 19.7% |
| Interquartile 75% (IQ3) | 58.3% | 35.9% |
| Interquartile Range (IQR) | 25.6% | 16.1% |
| Standard Deviation (Sample) | 21.5% | 13.3% |
| Standard Deviation (Population) | 21.4% | 13.2% |
Similar Demographics by Single Mother Poverty
Demographics Similar to Finns by Single Mother Poverty
In terms of single mother poverty, the demographic groups most similar to Finns are German (30.0%, a difference of 0.070%), Hungarian (29.9%, a difference of 0.14%), Immigrants from Ghana (29.9%, a difference of 0.25%), Immigrants from Eritrea (30.0%, a difference of 0.25%), and Sudanese (30.0%, a difference of 0.25%).
| Demographics | Rating | Rank | Single Mother Poverty |
| Nicaraguans | 12.4 /100 | #212 | Poor 29.8% |
| Immigrants | Thailand | 12.0 /100 | #213 | Poor 29.9% |
| Liberians | 11.7 /100 | #214 | Poor 29.9% |
| Jamaicans | 11.7 /100 | #215 | Poor 29.9% |
| Immigrants | Western Africa | 11.5 /100 | #216 | Poor 29.9% |
| Immigrants | Ghana | 11.3 /100 | #217 | Poor 29.9% |
| Hungarians | 10.3 /100 | #218 | Poor 29.9% |
| Finns | 9.3 /100 | #219 | Tragic 30.0% |
| Germans | 8.8 /100 | #220 | Tragic 30.0% |
| Immigrants | Eritrea | 7.7 /100 | #221 | Tragic 30.0% |
| Sudanese | 7.6 /100 | #222 | Tragic 30.0% |
| Immigrants | Cuba | 6.9 /100 | #223 | Tragic 30.1% |
| Immigrants | Sudan | 6.5 /100 | #224 | Tragic 30.1% |
| Spanish | 6.3 /100 | #225 | Tragic 30.1% |
| Scottish | 6.0 /100 | #226 | Tragic 30.1% |
Demographics Similar to Zimbabweans by Single Mother Poverty
In terms of single mother poverty, the demographic groups most similar to Zimbabweans are Immigrants from Netherlands (27.9%, a difference of 0.050%), Immigrants from Nepal (27.9%, a difference of 0.060%), Immigrants from Brazil (27.9%, a difference of 0.070%), Pakistani (28.0%, a difference of 0.070%), and Immigrants from Iraq (27.9%, a difference of 0.11%).
| Demographics | Rating | Rank | Single Mother Poverty |
| Romanians | 97.8 /100 | #93 | Exceptional 27.8% |
| Albanians | 97.6 /100 | #94 | Exceptional 27.9% |
| Chileans | 97.5 /100 | #95 | Exceptional 27.9% |
| Immigrants | Iraq | 97.3 /100 | #96 | Exceptional 27.9% |
| Immigrants | Brazil | 97.2 /100 | #97 | Exceptional 27.9% |
| Immigrants | Nepal | 97.2 /100 | #98 | Exceptional 27.9% |
| Immigrants | Netherlands | 97.2 /100 | #99 | Exceptional 27.9% |
| Zimbabweans | 97.1 /100 | #100 | Exceptional 27.9% |
| Pakistanis | 96.9 /100 | #101 | Exceptional 28.0% |
| Immigrants | Croatia | 96.7 /100 | #102 | Exceptional 28.0% |
| Immigrants | Northern Africa | 96.6 /100 | #103 | Exceptional 28.0% |
| Italians | 96.6 /100 | #104 | Exceptional 28.0% |
| Israelis | 96.5 /100 | #105 | Exceptional 28.0% |
| Ukrainians | 96.4 /100 | #106 | Exceptional 28.0% |
| Immigrants | Venezuela | 95.8 /100 | #107 | Exceptional 28.1% |