Estonian vs Zimbabwean Single Mother Poverty
COMPARE
Estonian
Zimbabwean
Single Mother Poverty
Single Mother Poverty Comparison
Estonians
Zimbabweans
27.8%
SINGLE MOTHER POVERTY
97.9/ 100
METRIC RATING
92nd/ 347
METRIC RANK
27.9%
SINGLE MOTHER POVERTY
97.1/ 100
METRIC RATING
100th/ 347
METRIC RANK
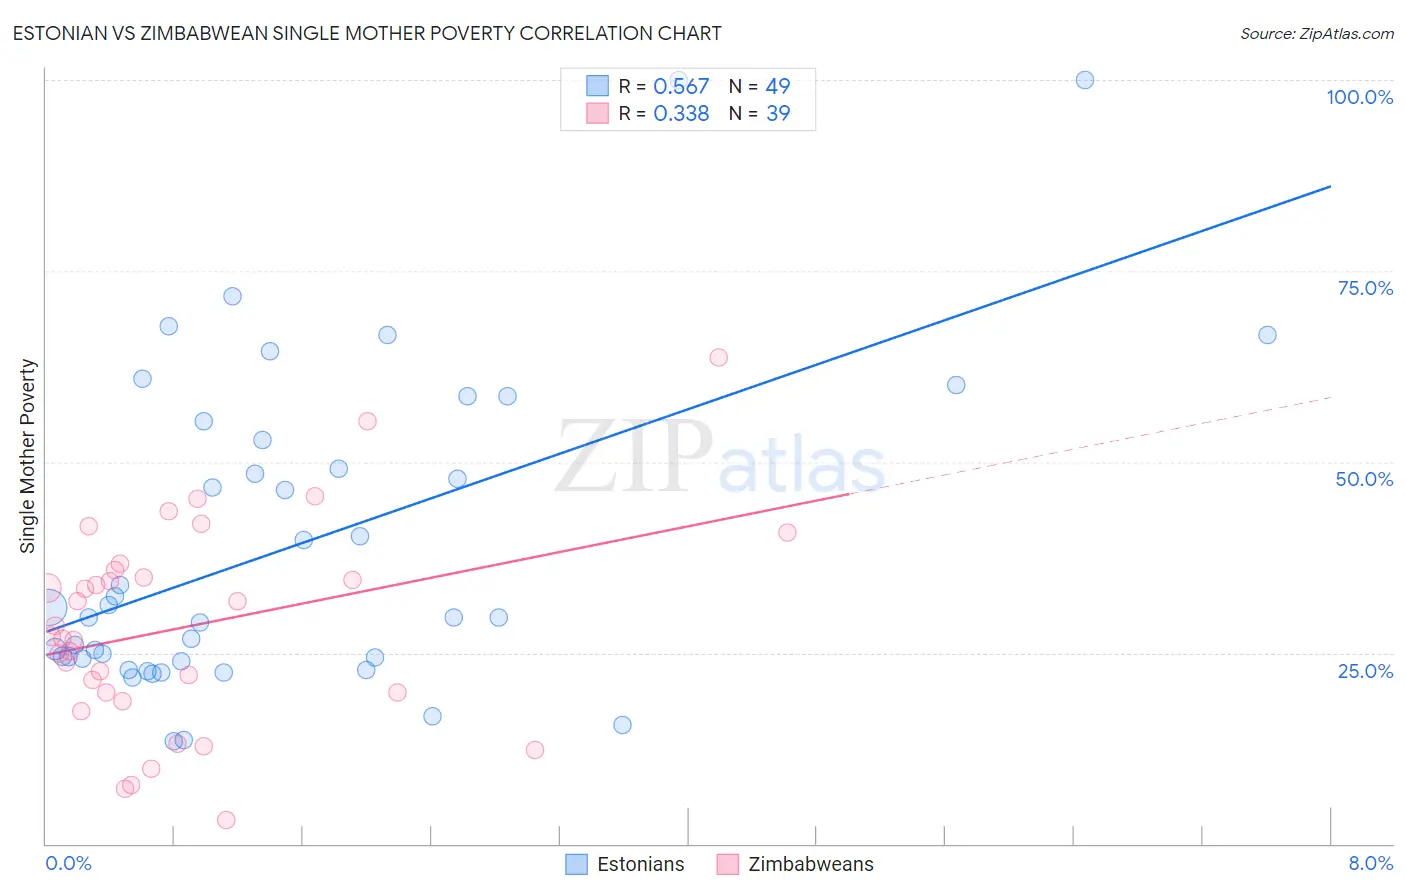
Estonian vs Zimbabwean Single Mother Poverty Correlation Chart
The statistical analysis conducted on geographies consisting of 121,617,183 people shows a substantial positive correlation between the proportion of Estonians and poverty level among single mothers in the United States with a correlation coefficient (R) of 0.567 and weighted average of 27.8%. Similarly, the statistical analysis conducted on geographies consisting of 68,932,281 people shows a mild positive correlation between the proportion of Zimbabweans and poverty level among single mothers in the United States with a correlation coefficient (R) of 0.338 and weighted average of 27.9%, a difference of 0.43%.
Single Mother Poverty Correlation Summary
| Measurement | Estonian | Zimbabwean |
| Minimum | 13.5% | 3.1% |
| Maximum | 100.0% | 63.7% |
| Range | 86.5% | 60.6% |
| Mean | 39.1% | 28.4% |
| Median | 29.6% | 27.1% |
| Interquartile 25% (IQ1) | 24.1% | 19.7% |
| Interquartile 75% (IQ3) | 54.1% | 35.9% |
| Interquartile Range (IQR) | 30.0% | 16.1% |
| Standard Deviation (Sample) | 20.8% | 13.3% |
| Standard Deviation (Population) | 20.6% | 13.2% |
Demographics Similar to Estonians and Zimbabweans by Single Mother Poverty
In terms of single mother poverty, the demographic groups most similar to Estonians are Immigrants from Albania (27.8%, a difference of 0.030%), Romanian (27.8%, a difference of 0.10%), Immigrants from France (27.8%, a difference of 0.17%), Albanian (27.9%, a difference of 0.19%), and Chilean (27.9%, a difference of 0.22%). Similarly, the demographic groups most similar to Zimbabweans are Immigrants from Netherlands (27.9%, a difference of 0.050%), Immigrants from Nepal (27.9%, a difference of 0.060%), Immigrants from Brazil (27.9%, a difference of 0.070%), Pakistani (28.0%, a difference of 0.070%), and Immigrants from Iraq (27.9%, a difference of 0.11%).
| Demographics | Rating | Rank | Single Mother Poverty |
| Immigrants | Ukraine | 98.6 /100 | #86 | Exceptional 27.7% |
| Afghans | 98.5 /100 | #87 | Exceptional 27.7% |
| Ethiopians | 98.4 /100 | #88 | Exceptional 27.7% |
| Immigrants | Ethiopia | 98.4 /100 | #89 | Exceptional 27.7% |
| Immigrants | France | 98.2 /100 | #90 | Exceptional 27.8% |
| Immigrants | Albania | 98.0 /100 | #91 | Exceptional 27.8% |
| Estonians | 97.9 /100 | #92 | Exceptional 27.8% |
| Romanians | 97.8 /100 | #93 | Exceptional 27.8% |
| Albanians | 97.6 /100 | #94 | Exceptional 27.9% |
| Chileans | 97.5 /100 | #95 | Exceptional 27.9% |
| Immigrants | Iraq | 97.3 /100 | #96 | Exceptional 27.9% |
| Immigrants | Brazil | 97.2 /100 | #97 | Exceptional 27.9% |
| Immigrants | Nepal | 97.2 /100 | #98 | Exceptional 27.9% |
| Immigrants | Netherlands | 97.2 /100 | #99 | Exceptional 27.9% |
| Zimbabweans | 97.1 /100 | #100 | Exceptional 27.9% |
| Pakistanis | 96.9 /100 | #101 | Exceptional 28.0% |
| Immigrants | Croatia | 96.7 /100 | #102 | Exceptional 28.0% |
| Immigrants | Northern Africa | 96.6 /100 | #103 | Exceptional 28.0% |
| Italians | 96.6 /100 | #104 | Exceptional 28.0% |
| Israelis | 96.5 /100 | #105 | Exceptional 28.0% |
| Ukrainians | 96.4 /100 | #106 | Exceptional 28.0% |