Finnish vs Immigrants from Oceania Single Mother Poverty
COMPARE
Finnish
Immigrants from Oceania
Single Mother Poverty
Single Mother Poverty Comparison
Finns
Immigrants from Oceania
30.0%
SINGLE MOTHER POVERTY
9.3/ 100
METRIC RATING
219th/ 347
METRIC RANK
28.7%
SINGLE MOTHER POVERTY
79.9/ 100
METRIC RATING
151st/ 347
METRIC RANK
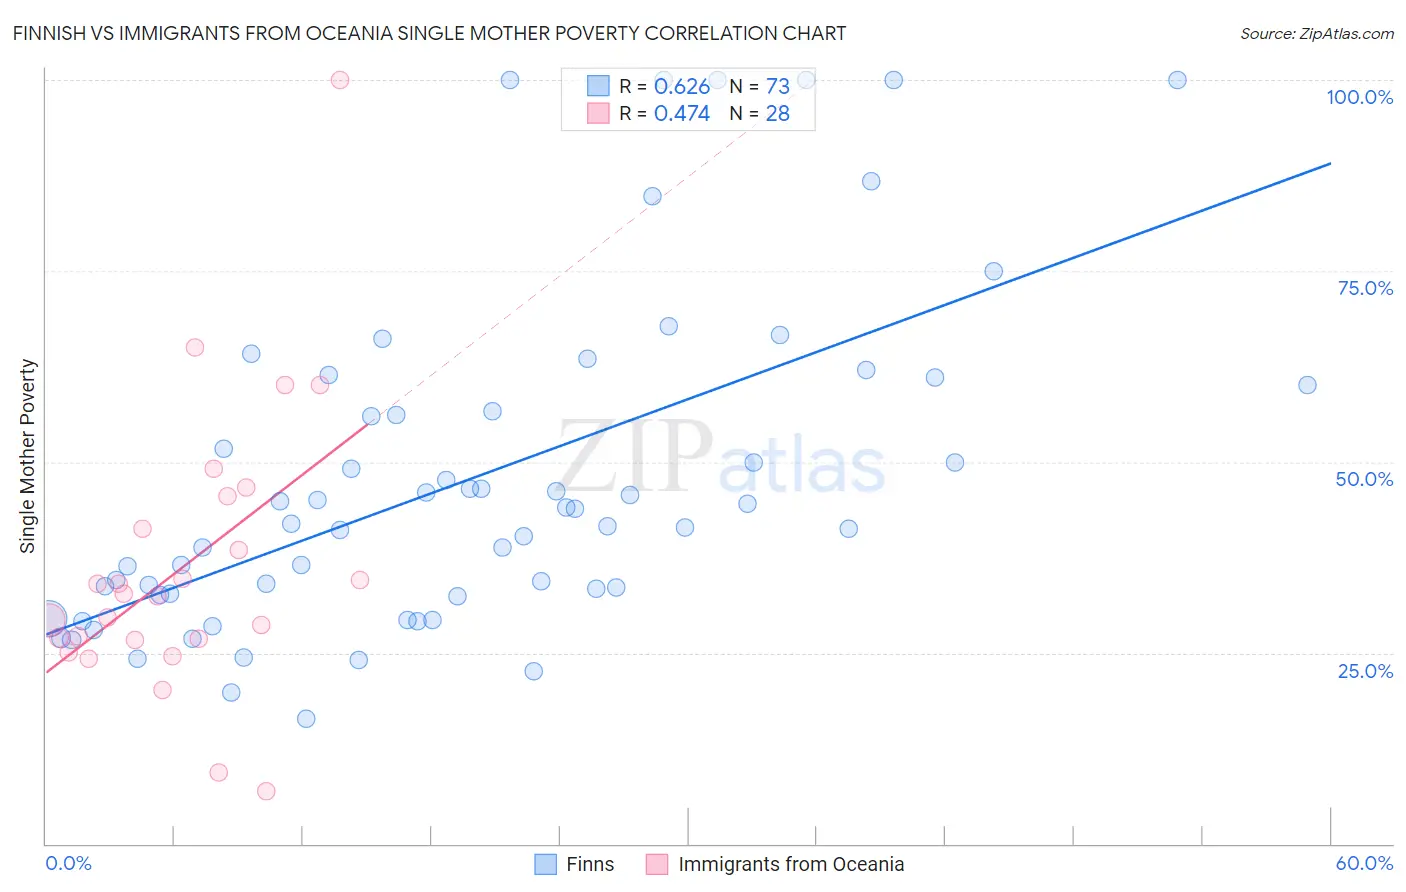
Finnish vs Immigrants from Oceania Single Mother Poverty Correlation Chart
The statistical analysis conducted on geographies consisting of 392,432,308 people shows a significant positive correlation between the proportion of Finns and poverty level among single mothers in the United States with a correlation coefficient (R) of 0.626 and weighted average of 30.0%. Similarly, the statistical analysis conducted on geographies consisting of 299,142,558 people shows a moderate positive correlation between the proportion of Immigrants from Oceania and poverty level among single mothers in the United States with a correlation coefficient (R) of 0.474 and weighted average of 28.7%, a difference of 4.4%.
Single Mother Poverty Correlation Summary
| Measurement | Finnish | Immigrants from Oceania |
| Minimum | 16.4% | 6.9% |
| Maximum | 100.0% | 100.0% |
| Range | 83.6% | 93.1% |
| Mean | 47.6% | 36.2% |
| Median | 42.0% | 32.5% |
| Interquartile 25% (IQ1) | 32.7% | 26.7% |
| Interquartile 75% (IQ3) | 58.3% | 43.3% |
| Interquartile Range (IQR) | 25.6% | 16.6% |
| Standard Deviation (Sample) | 21.5% | 18.5% |
| Standard Deviation (Population) | 21.4% | 18.1% |
Similar Demographics by Single Mother Poverty
Demographics Similar to Finns by Single Mother Poverty
In terms of single mother poverty, the demographic groups most similar to Finns are German (30.0%, a difference of 0.070%), Hungarian (29.9%, a difference of 0.14%), Immigrants from Ghana (29.9%, a difference of 0.25%), Immigrants from Eritrea (30.0%, a difference of 0.25%), and Sudanese (30.0%, a difference of 0.25%).
| Demographics | Rating | Rank | Single Mother Poverty |
| Nicaraguans | 12.4 /100 | #212 | Poor 29.8% |
| Immigrants | Thailand | 12.0 /100 | #213 | Poor 29.9% |
| Liberians | 11.7 /100 | #214 | Poor 29.9% |
| Jamaicans | 11.7 /100 | #215 | Poor 29.9% |
| Immigrants | Western Africa | 11.5 /100 | #216 | Poor 29.9% |
| Immigrants | Ghana | 11.3 /100 | #217 | Poor 29.9% |
| Hungarians | 10.3 /100 | #218 | Poor 29.9% |
| Finns | 9.3 /100 | #219 | Tragic 30.0% |
| Germans | 8.8 /100 | #220 | Tragic 30.0% |
| Immigrants | Eritrea | 7.7 /100 | #221 | Tragic 30.0% |
| Sudanese | 7.6 /100 | #222 | Tragic 30.0% |
| Immigrants | Cuba | 6.9 /100 | #223 | Tragic 30.1% |
| Immigrants | Sudan | 6.5 /100 | #224 | Tragic 30.1% |
| Spanish | 6.3 /100 | #225 | Tragic 30.1% |
| Scottish | 6.0 /100 | #226 | Tragic 30.1% |
Demographics Similar to Immigrants from Oceania by Single Mother Poverty
In terms of single mother poverty, the demographic groups most similar to Immigrants from Oceania are Austrian (28.7%, a difference of 0.070%), Northern European (28.6%, a difference of 0.14%), Slovene (28.8%, a difference of 0.25%), Serbian (28.6%, a difference of 0.44%), and Immigrants from Lebanon (28.6%, a difference of 0.46%).
| Demographics | Rating | Rank | Single Mother Poverty |
| Luxembourgers | 86.4 /100 | #144 | Excellent 28.5% |
| Immigrants | South America | 86.1 /100 | #145 | Excellent 28.5% |
| Immigrants | Denmark | 86.1 /100 | #146 | Excellent 28.5% |
| Immigrants | Lebanon | 85.3 /100 | #147 | Excellent 28.6% |
| Syrians | 85.3 /100 | #148 | Excellent 28.6% |
| Serbians | 85.0 /100 | #149 | Excellent 28.6% |
| Northern Europeans | 81.7 /100 | #150 | Excellent 28.6% |
| Immigrants | Oceania | 79.9 /100 | #151 | Good 28.7% |
| Austrians | 79.0 /100 | #152 | Good 28.7% |
| Slovenes | 76.4 /100 | #153 | Good 28.8% |
| Portuguese | 73.2 /100 | #154 | Good 28.8% |
| Ugandans | 71.7 /100 | #155 | Good 28.8% |
| Iraqis | 71.5 /100 | #156 | Good 28.8% |
| Immigrants | Western Europe | 71.1 /100 | #157 | Good 28.9% |
| Immigrants | Hungary | 70.6 /100 | #158 | Good 28.9% |