Finnish vs Dutch West Indian Single Mother Poverty
COMPARE
Finnish
Dutch West Indian
Single Mother Poverty
Single Mother Poverty Comparison
Finns
Dutch West Indians
30.0%
SINGLE MOTHER POVERTY
9.3/ 100
METRIC RATING
219th/ 347
METRIC RANK
36.8%
SINGLE MOTHER POVERTY
0.0/ 100
METRIC RATING
332nd/ 347
METRIC RANK
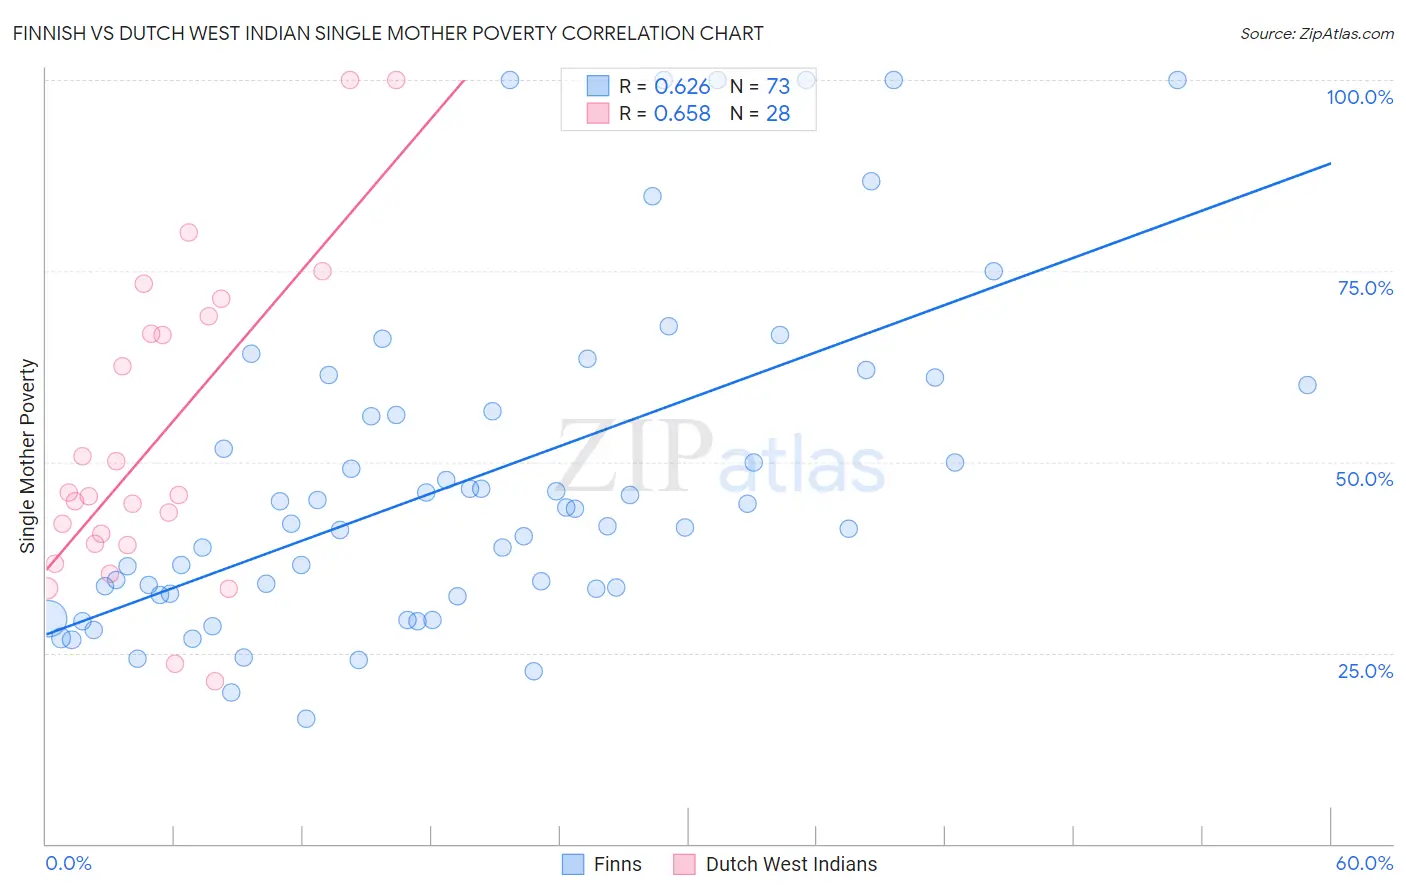
Finnish vs Dutch West Indian Single Mother Poverty Correlation Chart
The statistical analysis conducted on geographies consisting of 392,432,308 people shows a significant positive correlation between the proportion of Finns and poverty level among single mothers in the United States with a correlation coefficient (R) of 0.626 and weighted average of 30.0%. Similarly, the statistical analysis conducted on geographies consisting of 85,385,586 people shows a significant positive correlation between the proportion of Dutch West Indians and poverty level among single mothers in the United States with a correlation coefficient (R) of 0.658 and weighted average of 36.8%, a difference of 22.7%.
Single Mother Poverty Correlation Summary
| Measurement | Finnish | Dutch West Indian |
| Minimum | 16.4% | 21.3% |
| Maximum | 100.0% | 100.0% |
| Range | 83.6% | 78.7% |
| Mean | 47.6% | 52.8% |
| Median | 42.0% | 45.6% |
| Interquartile 25% (IQ1) | 32.7% | 39.2% |
| Interquartile 75% (IQ3) | 58.3% | 67.9% |
| Interquartile Range (IQR) | 25.6% | 28.7% |
| Standard Deviation (Sample) | 21.5% | 20.5% |
| Standard Deviation (Population) | 21.4% | 20.2% |
Similar Demographics by Single Mother Poverty
Demographics Similar to Finns by Single Mother Poverty
In terms of single mother poverty, the demographic groups most similar to Finns are German (30.0%, a difference of 0.070%), Hungarian (29.9%, a difference of 0.14%), Immigrants from Ghana (29.9%, a difference of 0.25%), Immigrants from Eritrea (30.0%, a difference of 0.25%), and Sudanese (30.0%, a difference of 0.25%).
| Demographics | Rating | Rank | Single Mother Poverty |
| Nicaraguans | 12.4 /100 | #212 | Poor 29.8% |
| Immigrants | Thailand | 12.0 /100 | #213 | Poor 29.9% |
| Liberians | 11.7 /100 | #214 | Poor 29.9% |
| Jamaicans | 11.7 /100 | #215 | Poor 29.9% |
| Immigrants | Western Africa | 11.5 /100 | #216 | Poor 29.9% |
| Immigrants | Ghana | 11.3 /100 | #217 | Poor 29.9% |
| Hungarians | 10.3 /100 | #218 | Poor 29.9% |
| Finns | 9.3 /100 | #219 | Tragic 30.0% |
| Germans | 8.8 /100 | #220 | Tragic 30.0% |
| Immigrants | Eritrea | 7.7 /100 | #221 | Tragic 30.0% |
| Sudanese | 7.6 /100 | #222 | Tragic 30.0% |
| Immigrants | Cuba | 6.9 /100 | #223 | Tragic 30.1% |
| Immigrants | Sudan | 6.5 /100 | #224 | Tragic 30.1% |
| Spanish | 6.3 /100 | #225 | Tragic 30.1% |
| Scottish | 6.0 /100 | #226 | Tragic 30.1% |
Demographics Similar to Dutch West Indians by Single Mother Poverty
In terms of single mother poverty, the demographic groups most similar to Dutch West Indians are Creek (36.7%, a difference of 0.24%), Native/Alaskan (36.6%, a difference of 0.40%), Apache (36.6%, a difference of 0.50%), Menominee (37.1%, a difference of 0.78%), and Choctaw (36.4%, a difference of 0.98%).
| Demographics | Rating | Rank | Single Mother Poverty |
| Ute | 0.0 /100 | #325 | Tragic 35.7% |
| Seminole | 0.0 /100 | #326 | Tragic 35.8% |
| Yakama | 0.0 /100 | #327 | Tragic 36.4% |
| Choctaw | 0.0 /100 | #328 | Tragic 36.4% |
| Apache | 0.0 /100 | #329 | Tragic 36.6% |
| Natives/Alaskans | 0.0 /100 | #330 | Tragic 36.6% |
| Creek | 0.0 /100 | #331 | Tragic 36.7% |
| Dutch West Indians | 0.0 /100 | #332 | Tragic 36.8% |
| Menominee | 0.0 /100 | #333 | Tragic 37.1% |
| Pueblo | 0.0 /100 | #334 | Tragic 37.2% |
| Yuman | 0.0 /100 | #335 | Tragic 37.8% |
| Cheyenne | 0.0 /100 | #336 | Tragic 38.5% |
| Immigrants | Yemen | 0.0 /100 | #337 | Tragic 38.5% |
| Pima | 0.0 /100 | #338 | Tragic 38.6% |
| Crow | 0.0 /100 | #339 | Tragic 38.6% |