Cypriot vs Zimbabwean Single Mother Poverty
COMPARE
Cypriot
Zimbabwean
Single Mother Poverty
Single Mother Poverty Comparison
Cypriots
Zimbabweans
28.3%
SINGLE MOTHER POVERTY
92.3/ 100
METRIC RATING
120th/ 347
METRIC RANK
27.9%
SINGLE MOTHER POVERTY
97.1/ 100
METRIC RATING
100th/ 347
METRIC RANK
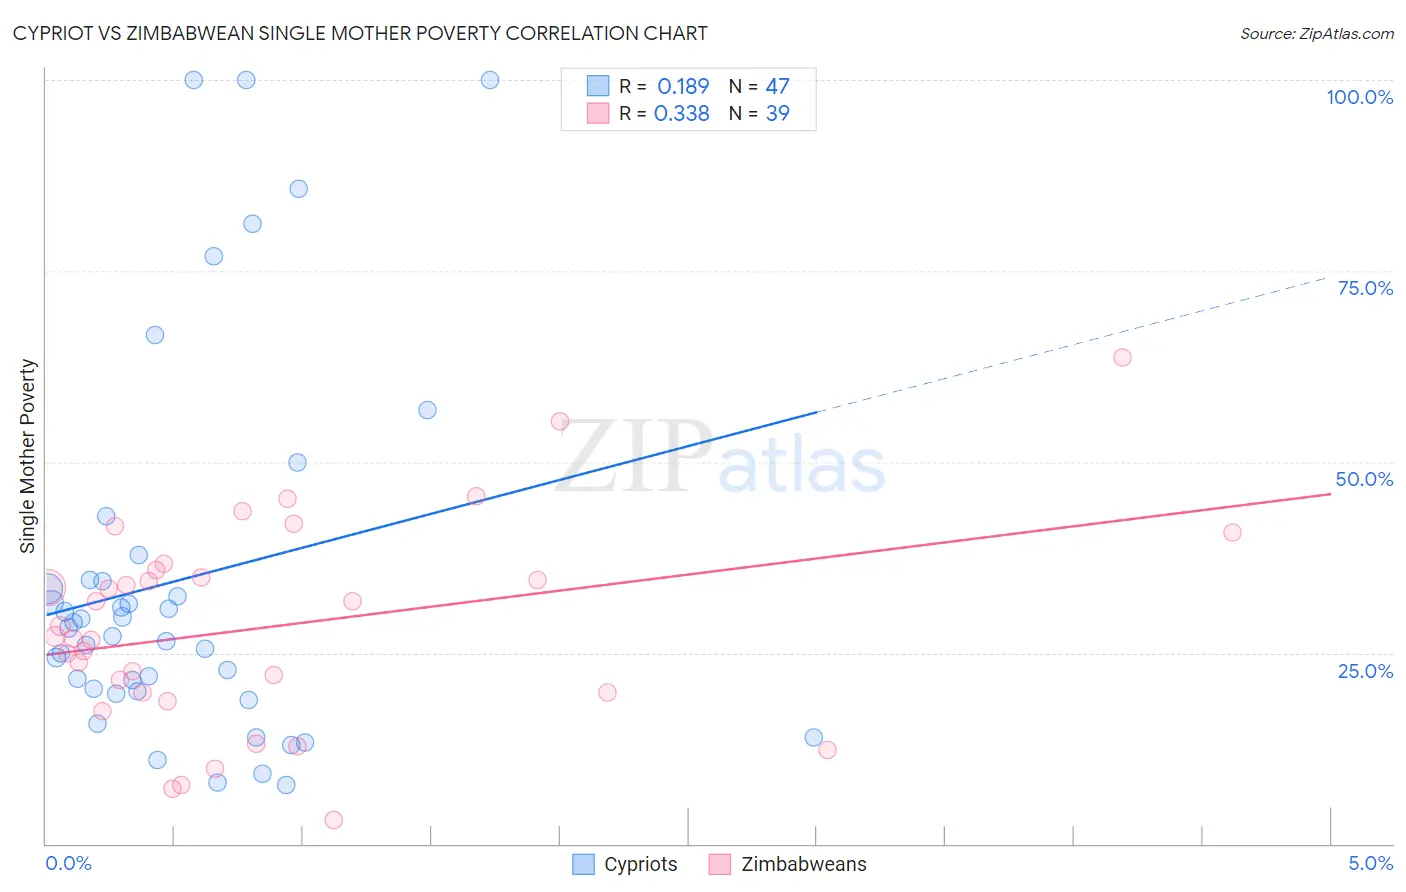
Cypriot vs Zimbabwean Single Mother Poverty Correlation Chart
The statistical analysis conducted on geographies consisting of 61,106,831 people shows a poor positive correlation between the proportion of Cypriots and poverty level among single mothers in the United States with a correlation coefficient (R) of 0.189 and weighted average of 28.3%. Similarly, the statistical analysis conducted on geographies consisting of 68,932,281 people shows a mild positive correlation between the proportion of Zimbabweans and poverty level among single mothers in the United States with a correlation coefficient (R) of 0.338 and weighted average of 27.9%, a difference of 1.3%.
Single Mother Poverty Correlation Summary
| Measurement | Cypriot | Zimbabwean |
| Minimum | 7.7% | 3.1% |
| Maximum | 100.0% | 63.7% |
| Range | 92.3% | 60.6% |
| Mean | 34.7% | 28.4% |
| Median | 28.2% | 27.1% |
| Interquartile 25% (IQ1) | 20.0% | 19.7% |
| Interquartile 75% (IQ3) | 34.6% | 35.9% |
| Interquartile Range (IQR) | 14.7% | 16.1% |
| Standard Deviation (Sample) | 24.8% | 13.3% |
| Standard Deviation (Population) | 24.5% | 13.2% |
Demographics Similar to Cypriots and Zimbabweans by Single Mother Poverty
In terms of single mother poverty, the demographic groups most similar to Cypriots are Immigrants from Syria (28.3%, a difference of 0.020%), Brazilian (28.3%, a difference of 0.030%), Australian (28.3%, a difference of 0.040%), Immigrants from Uganda (28.3%, a difference of 0.050%), and Immigrants from Kuwait (28.3%, a difference of 0.070%). Similarly, the demographic groups most similar to Zimbabweans are Pakistani (28.0%, a difference of 0.070%), Immigrants from Croatia (28.0%, a difference of 0.17%), Immigrants from Northern Africa (28.0%, a difference of 0.18%), Italian (28.0%, a difference of 0.20%), and Israeli (28.0%, a difference of 0.23%).
| Demographics | Rating | Rank | Single Mother Poverty |
| Zimbabweans | 97.1 /100 | #100 | Exceptional 27.9% |
| Pakistanis | 96.9 /100 | #101 | Exceptional 28.0% |
| Immigrants | Croatia | 96.7 /100 | #102 | Exceptional 28.0% |
| Immigrants | Northern Africa | 96.6 /100 | #103 | Exceptional 28.0% |
| Italians | 96.6 /100 | #104 | Exceptional 28.0% |
| Israelis | 96.5 /100 | #105 | Exceptional 28.0% |
| Ukrainians | 96.4 /100 | #106 | Exceptional 28.0% |
| Immigrants | Venezuela | 95.8 /100 | #107 | Exceptional 28.1% |
| Immigrants | Zimbabwe | 95.5 /100 | #108 | Exceptional 28.1% |
| Immigrants | Armenia | 95.2 /100 | #109 | Exceptional 28.1% |
| Croatians | 94.8 /100 | #110 | Exceptional 28.2% |
| Venezuelans | 94.5 /100 | #111 | Exceptional 28.2% |
| Immigrants | Kazakhstan | 94.5 /100 | #112 | Exceptional 28.2% |
| Immigrants | South Africa | 93.2 /100 | #113 | Exceptional 28.3% |
| Immigrants | Western Asia | 92.7 /100 | #114 | Exceptional 28.3% |
| Immigrants | Kuwait | 92.7 /100 | #115 | Exceptional 28.3% |
| Immigrants | Uganda | 92.5 /100 | #116 | Exceptional 28.3% |
| Australians | 92.5 /100 | #117 | Exceptional 28.3% |
| Brazilians | 92.4 /100 | #118 | Exceptional 28.3% |
| Immigrants | Syria | 92.4 /100 | #119 | Exceptional 28.3% |
| Cypriots | 92.3 /100 | #120 | Exceptional 28.3% |