Finnish vs Guamanian/Chamorro Single Father Poverty
COMPARE
Finnish
Guamanian/Chamorro
Single Father Poverty
Single Father Poverty Comparison
Finns
Guamanians/Chamorros
16.9%
SINGLE FATHER POVERTY
2.6/ 100
METRIC RATING
240th/ 347
METRIC RANK
15.1%
SINGLE FATHER POVERTY
99.9/ 100
METRIC RATING
59th/ 347
METRIC RANK
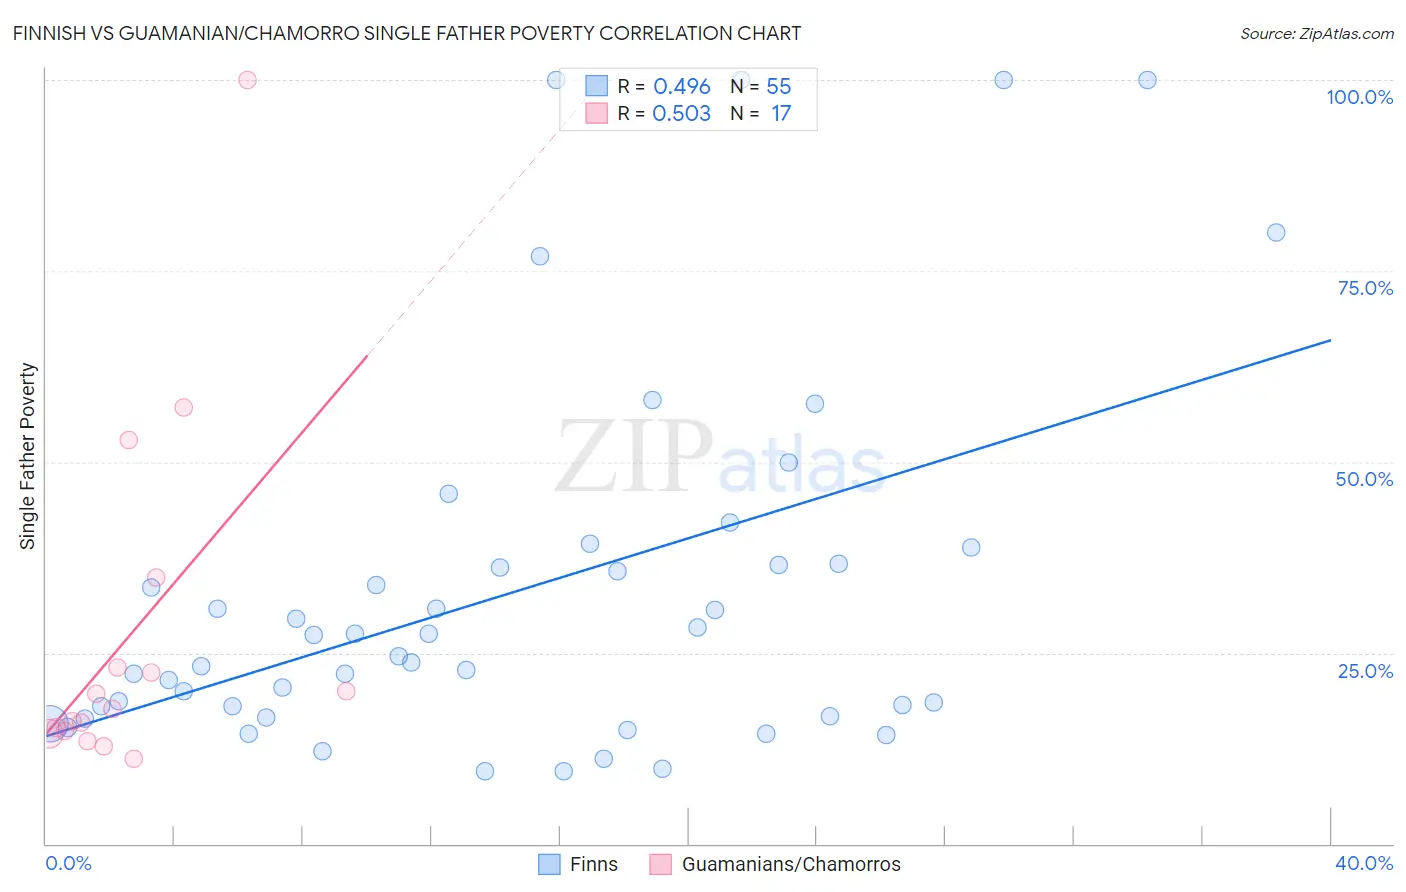
Finnish vs Guamanian/Chamorro Single Father Poverty Correlation Chart
The statistical analysis conducted on geographies consisting of 310,078,024 people shows a moderate positive correlation between the proportion of Finns and poverty level among single fathers in the United States with a correlation coefficient (R) of 0.496 and weighted average of 16.9%. Similarly, the statistical analysis conducted on geographies consisting of 191,371,634 people shows a substantial positive correlation between the proportion of Guamanians/Chamorros and poverty level among single fathers in the United States with a correlation coefficient (R) of 0.503 and weighted average of 15.1%, a difference of 12.3%.
Single Father Poverty Correlation Summary
| Measurement | Finnish | Guamanian/Chamorro |
| Minimum | 9.5% | 11.2% |
| Maximum | 100.0% | 100.0% |
| Range | 90.5% | 88.8% |
| Mean | 33.0% | 27.1% |
| Median | 24.5% | 17.6% |
| Interquartile 25% (IQ1) | 16.7% | 14.6% |
| Interquartile 75% (IQ3) | 36.6% | 29.0% |
| Interquartile Range (IQR) | 20.0% | 14.4% |
| Standard Deviation (Sample) | 24.2% | 23.1% |
| Standard Deviation (Population) | 24.0% | 22.4% |
Similar Demographics by Single Father Poverty
Demographics Similar to Finns by Single Father Poverty
In terms of single father poverty, the demographic groups most similar to Finns are Bermudan (16.9%, a difference of 0.010%), Immigrants from Saudi Arabia (16.9%, a difference of 0.030%), Immigrants from Western Europe (16.9%, a difference of 0.10%), Immigrants from Germany (16.9%, a difference of 0.10%), and Subsaharan African (16.9%, a difference of 0.10%).
| Demographics | Rating | Rank | Single Father Poverty |
| Senegalese | 3.2 /100 | #233 | Tragic 16.9% |
| Marshallese | 3.1 /100 | #234 | Tragic 16.9% |
| Immigrants | Western Europe | 2.9 /100 | #235 | Tragic 16.9% |
| Immigrants | Germany | 2.9 /100 | #236 | Tragic 16.9% |
| Sub-Saharan Africans | 2.9 /100 | #237 | Tragic 16.9% |
| Immigrants | Saudi Arabia | 2.7 /100 | #238 | Tragic 16.9% |
| Bermudans | 2.6 /100 | #239 | Tragic 16.9% |
| Finns | 2.6 /100 | #240 | Tragic 16.9% |
| Czechs | 2.3 /100 | #241 | Tragic 17.0% |
| Moroccans | 2.1 /100 | #242 | Tragic 17.0% |
| Immigrants | Cabo Verde | 1.6 /100 | #243 | Tragic 17.0% |
| Hondurans | 1.6 /100 | #244 | Tragic 17.0% |
| Trinidadians and Tobagonians | 1.5 /100 | #245 | Tragic 17.0% |
| Immigrants | Ireland | 1.4 /100 | #246 | Tragic 17.1% |
| Greeks | 1.3 /100 | #247 | Tragic 17.1% |
Demographics Similar to Guamanians/Chamorros by Single Father Poverty
In terms of single father poverty, the demographic groups most similar to Guamanians/Chamorros are Hawaiian (15.1%, a difference of 0.10%), Laotian (15.1%, a difference of 0.15%), Immigrants from Laos (15.1%, a difference of 0.24%), Puget Sound Salish (15.2%, a difference of 0.40%), and Immigrants from Bosnia and Herzegovina (15.2%, a difference of 0.45%).
| Demographics | Rating | Rank | Single Father Poverty |
| Immigrants | El Salvador | 99.9 /100 | #52 | Exceptional 15.0% |
| Immigrants | Kenya | 99.9 /100 | #53 | Exceptional 15.0% |
| Immigrants | Uzbekistan | 99.9 /100 | #54 | Exceptional 15.0% |
| Immigrants | Bulgaria | 99.9 /100 | #55 | Exceptional 15.0% |
| Immigrants | Laos | 99.9 /100 | #56 | Exceptional 15.1% |
| Laotians | 99.9 /100 | #57 | Exceptional 15.1% |
| Hawaiians | 99.9 /100 | #58 | Exceptional 15.1% |
| Guamanians/Chamorros | 99.9 /100 | #59 | Exceptional 15.1% |
| Puget Sound Salish | 99.8 /100 | #60 | Exceptional 15.2% |
| Immigrants | Bosnia and Herzegovina | 99.8 /100 | #61 | Exceptional 15.2% |
| Immigrants | Armenia | 99.8 /100 | #62 | Exceptional 15.2% |
| Immigrants | Sweden | 99.8 /100 | #63 | Exceptional 15.2% |
| Bangladeshis | 99.8 /100 | #64 | Exceptional 15.2% |
| Immigrants | Malaysia | 99.8 /100 | #65 | Exceptional 15.2% |
| Immigrants | Moldova | 99.8 /100 | #66 | Exceptional 15.2% |