Finnish vs African Single Father Poverty
COMPARE
Finnish
African
Single Father Poverty
Single Father Poverty Comparison
Finns
Africans
16.9%
SINGLE FATHER POVERTY
2.6/ 100
METRIC RATING
240th/ 347
METRIC RANK
18.3%
SINGLE FATHER POVERTY
0.0/ 100
METRIC RATING
298th/ 347
METRIC RANK
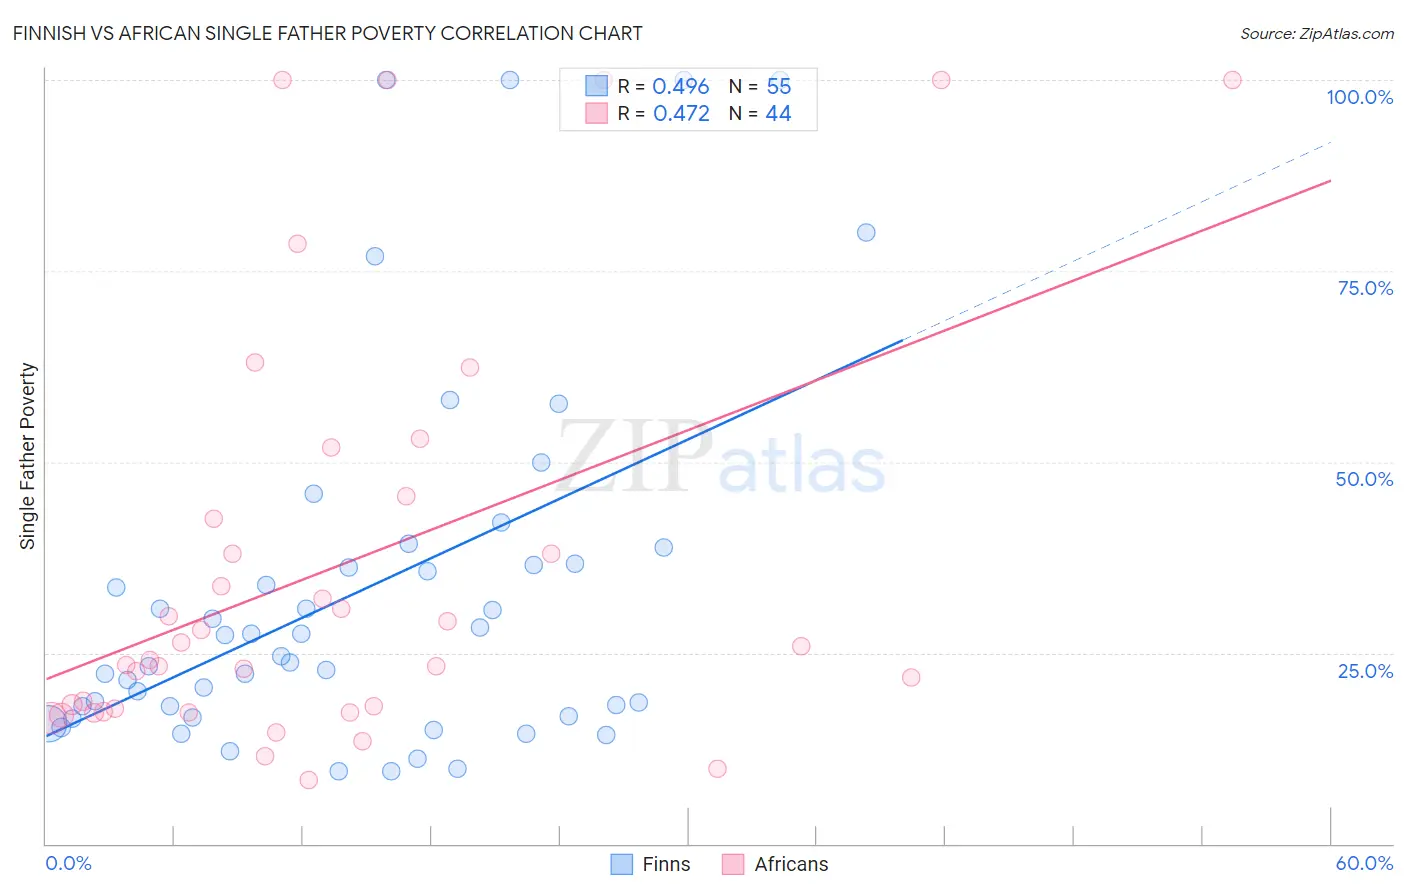
Finnish vs African Single Father Poverty Correlation Chart
The statistical analysis conducted on geographies consisting of 310,078,024 people shows a moderate positive correlation between the proportion of Finns and poverty level among single fathers in the United States with a correlation coefficient (R) of 0.496 and weighted average of 16.9%. Similarly, the statistical analysis conducted on geographies consisting of 369,651,911 people shows a moderate positive correlation between the proportion of Africans and poverty level among single fathers in the United States with a correlation coefficient (R) of 0.472 and weighted average of 18.3%, a difference of 8.1%.
Single Father Poverty Correlation Summary
| Measurement | Finnish | African |
| Minimum | 9.5% | 8.3% |
| Maximum | 100.0% | 100.0% |
| Range | 90.5% | 91.7% |
| Mean | 33.0% | 36.4% |
| Median | 24.5% | 25.0% |
| Interquartile 25% (IQ1) | 16.7% | 17.5% |
| Interquartile 75% (IQ3) | 36.6% | 44.0% |
| Interquartile Range (IQR) | 20.0% | 26.5% |
| Standard Deviation (Sample) | 24.2% | 27.5% |
| Standard Deviation (Population) | 24.0% | 27.1% |
Similar Demographics by Single Father Poverty
Demographics Similar to Finns by Single Father Poverty
In terms of single father poverty, the demographic groups most similar to Finns are Bermudan (16.9%, a difference of 0.010%), Immigrants from Saudi Arabia (16.9%, a difference of 0.030%), Immigrants from Western Europe (16.9%, a difference of 0.10%), Immigrants from Germany (16.9%, a difference of 0.10%), and Subsaharan African (16.9%, a difference of 0.10%).
| Demographics | Rating | Rank | Single Father Poverty |
| Senegalese | 3.2 /100 | #233 | Tragic 16.9% |
| Marshallese | 3.1 /100 | #234 | Tragic 16.9% |
| Immigrants | Western Europe | 2.9 /100 | #235 | Tragic 16.9% |
| Immigrants | Germany | 2.9 /100 | #236 | Tragic 16.9% |
| Sub-Saharan Africans | 2.9 /100 | #237 | Tragic 16.9% |
| Immigrants | Saudi Arabia | 2.7 /100 | #238 | Tragic 16.9% |
| Bermudans | 2.6 /100 | #239 | Tragic 16.9% |
| Finns | 2.6 /100 | #240 | Tragic 16.9% |
| Czechs | 2.3 /100 | #241 | Tragic 17.0% |
| Moroccans | 2.1 /100 | #242 | Tragic 17.0% |
| Immigrants | Cabo Verde | 1.6 /100 | #243 | Tragic 17.0% |
| Hondurans | 1.6 /100 | #244 | Tragic 17.0% |
| Trinidadians and Tobagonians | 1.5 /100 | #245 | Tragic 17.0% |
| Immigrants | Ireland | 1.4 /100 | #246 | Tragic 17.1% |
| Greeks | 1.3 /100 | #247 | Tragic 17.1% |
Demographics Similar to Africans by Single Father Poverty
In terms of single father poverty, the demographic groups most similar to Africans are White/Caucasian (18.4%, a difference of 0.21%), Immigrants from Dominican Republic (18.4%, a difference of 0.53%), French (18.2%, a difference of 0.75%), Hungarian (18.5%, a difference of 0.75%), and Comanche (18.5%, a difference of 0.86%).
| Demographics | Rating | Rank | Single Father Poverty |
| Alaskan Athabascans | 0.0 /100 | #291 | Tragic 18.1% |
| Immigrants | Bahamas | 0.0 /100 | #292 | Tragic 18.1% |
| Alaska Natives | 0.0 /100 | #293 | Tragic 18.1% |
| U.S. Virgin Islanders | 0.0 /100 | #294 | Tragic 18.1% |
| Yakama | 0.0 /100 | #295 | Tragic 18.1% |
| Seminole | 0.0 /100 | #296 | Tragic 18.1% |
| French | 0.0 /100 | #297 | Tragic 18.2% |
| Africans | 0.0 /100 | #298 | Tragic 18.3% |
| Whites/Caucasians | 0.0 /100 | #299 | Tragic 18.4% |
| Immigrants | Dominican Republic | 0.0 /100 | #300 | Tragic 18.4% |
| Hungarians | 0.0 /100 | #301 | Tragic 18.5% |
| Comanche | 0.0 /100 | #302 | Tragic 18.5% |
| Celtics | 0.0 /100 | #303 | Tragic 18.5% |
| Ute | 0.0 /100 | #304 | Tragic 18.5% |
| Blackfeet | 0.0 /100 | #305 | Tragic 18.5% |