Finnish vs Immigrants from Yemen Male Poverty
COMPARE
Finnish
Immigrants from Yemen
Male Poverty
Male Poverty Comparison
Finns
Immigrants from Yemen
10.5%
MALE POVERTY
93.4/ 100
METRIC RATING
98th/ 347
METRIC RANK
20.1%
MALE POVERTY
0.0/ 100
METRIC RATING
340th/ 347
METRIC RANK
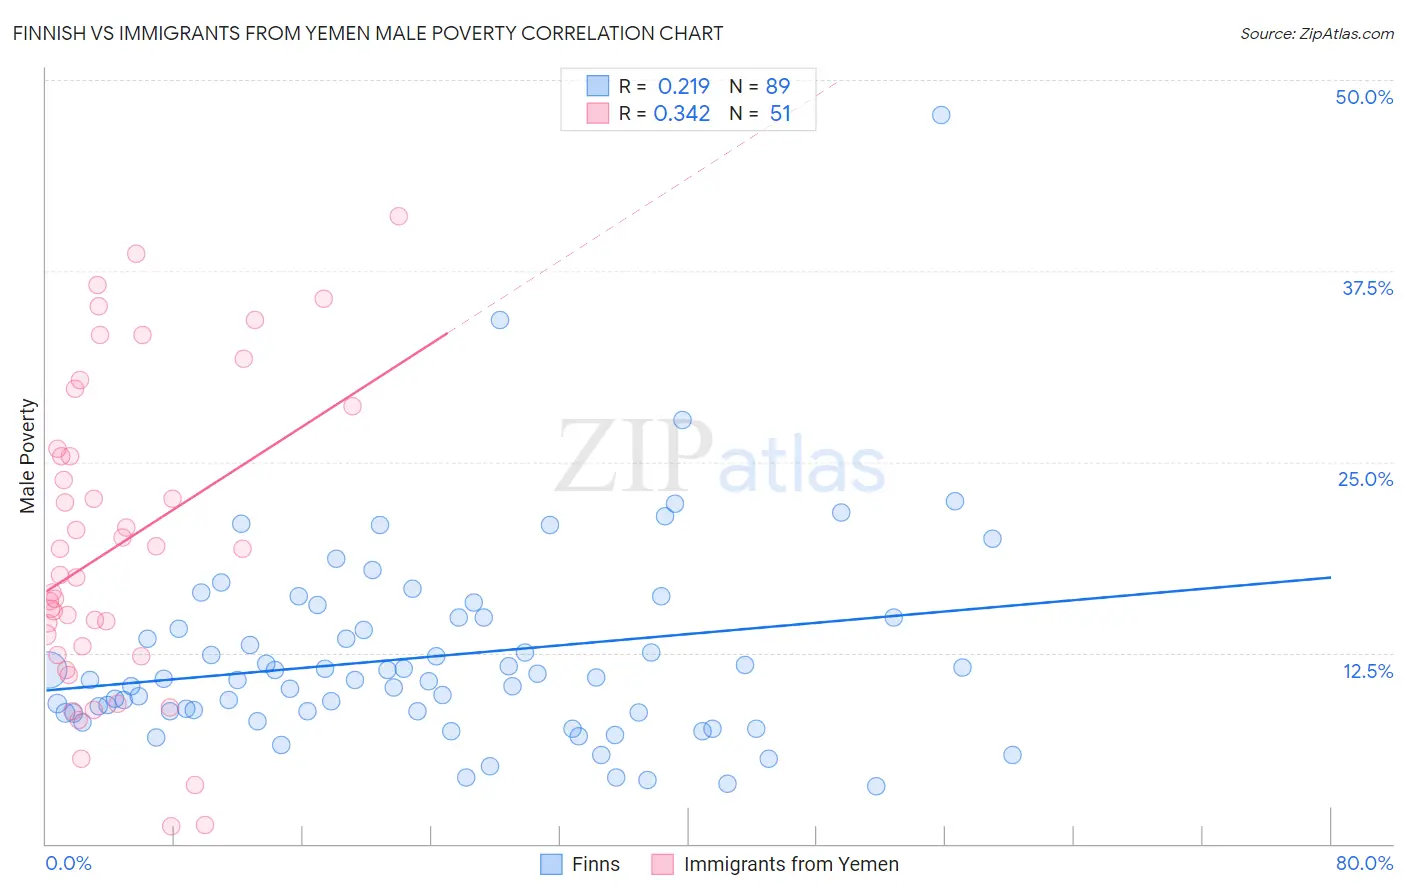
Finnish vs Immigrants from Yemen Male Poverty Correlation Chart
The statistical analysis conducted on geographies consisting of 404,315,970 people shows a weak positive correlation between the proportion of Finns and poverty level among males in the United States with a correlation coefficient (R) of 0.219 and weighted average of 10.5%. Similarly, the statistical analysis conducted on geographies consisting of 82,433,611 people shows a mild positive correlation between the proportion of Immigrants from Yemen and poverty level among males in the United States with a correlation coefficient (R) of 0.342 and weighted average of 20.1%, a difference of 92.6%.
Male Poverty Correlation Summary
| Measurement | Finnish | Immigrants from Yemen |
| Minimum | 3.8% | 1.1% |
| Maximum | 47.7% | 41.1% |
| Range | 43.9% | 40.0% |
| Mean | 12.3% | 19.6% |
| Median | 10.8% | 17.6% |
| Interquartile 25% (IQ1) | 8.6% | 12.4% |
| Interquartile 75% (IQ3) | 14.8% | 25.9% |
| Interquartile Range (IQR) | 6.3% | 13.5% |
| Standard Deviation (Sample) | 6.6% | 10.0% |
| Standard Deviation (Population) | 6.6% | 9.9% |
Similar Demographics by Male Poverty
Demographics Similar to Finns by Male Poverty
In terms of male poverty, the demographic groups most similar to Finns are Romanian (10.5%, a difference of 0.060%), Immigrants from Indonesia (10.5%, a difference of 0.060%), Immigrants from Egypt (10.4%, a difference of 0.11%), Scottish (10.4%, a difference of 0.24%), and Immigrants from South Africa (10.4%, a difference of 0.28%).
| Demographics | Rating | Rank | Male Poverty |
| British | 94.8 /100 | #91 | Exceptional 10.4% |
| Jordanians | 94.4 /100 | #92 | Exceptional 10.4% |
| Australians | 94.4 /100 | #93 | Exceptional 10.4% |
| Immigrants | South Africa | 94.1 /100 | #94 | Exceptional 10.4% |
| Scottish | 94.0 /100 | #95 | Exceptional 10.4% |
| Immigrants | Egypt | 93.7 /100 | #96 | Exceptional 10.4% |
| Romanians | 93.6 /100 | #97 | Exceptional 10.5% |
| Finns | 93.4 /100 | #98 | Exceptional 10.5% |
| Immigrants | Indonesia | 93.3 /100 | #99 | Exceptional 10.5% |
| Immigrants | Latvia | 92.8 /100 | #100 | Exceptional 10.5% |
| Immigrants | Zimbabwe | 92.0 /100 | #101 | Exceptional 10.5% |
| French Canadians | 91.9 /100 | #102 | Exceptional 10.5% |
| Slavs | 91.7 /100 | #103 | Exceptional 10.5% |
| Welsh | 91.6 /100 | #104 | Exceptional 10.5% |
| Canadians | 91.6 /100 | #105 | Exceptional 10.5% |
Demographics Similar to Immigrants from Yemen by Male Poverty
In terms of male poverty, the demographic groups most similar to Immigrants from Yemen are Lumbee (20.2%, a difference of 0.30%), Pima (20.4%, a difference of 1.1%), Yup'ik (20.4%, a difference of 1.2%), Yuman (19.5%, a difference of 3.1%), and Hopi (20.8%, a difference of 3.3%).
| Demographics | Rating | Rank | Male Poverty |
| Natives/Alaskans | 0.0 /100 | #333 | Tragic 16.9% |
| Cheyenne | 0.0 /100 | #334 | Tragic 17.6% |
| Apache | 0.0 /100 | #335 | Tragic 17.7% |
| Pueblo | 0.0 /100 | #336 | Tragic 18.5% |
| Sioux | 0.0 /100 | #337 | Tragic 18.7% |
| Crow | 0.0 /100 | #338 | Tragic 19.1% |
| Yuman | 0.0 /100 | #339 | Tragic 19.5% |
| Immigrants | Yemen | 0.0 /100 | #340 | Tragic 20.1% |
| Lumbee | 0.0 /100 | #341 | Tragic 20.2% |
| Pima | 0.0 /100 | #342 | Tragic 20.4% |
| Yup'ik | 0.0 /100 | #343 | Tragic 20.4% |
| Hopi | 0.0 /100 | #344 | Tragic 20.8% |
| Puerto Ricans | 0.0 /100 | #345 | Tragic 22.0% |
| Navajo | 0.0 /100 | #346 | Tragic 22.3% |
| Tohono O'odham | 0.0 /100 | #347 | Tragic 22.9% |