Finnish vs Immigrants from Ukraine Male Poverty
COMPARE
Finnish
Immigrants from Ukraine
Male Poverty
Male Poverty Comparison
Finns
Immigrants from Ukraine
10.5%
MALE POVERTY
93.4/ 100
METRIC RATING
98th/ 347
METRIC RANK
10.7%
MALE POVERTY
84.3/ 100
METRIC RATING
126th/ 347
METRIC RANK
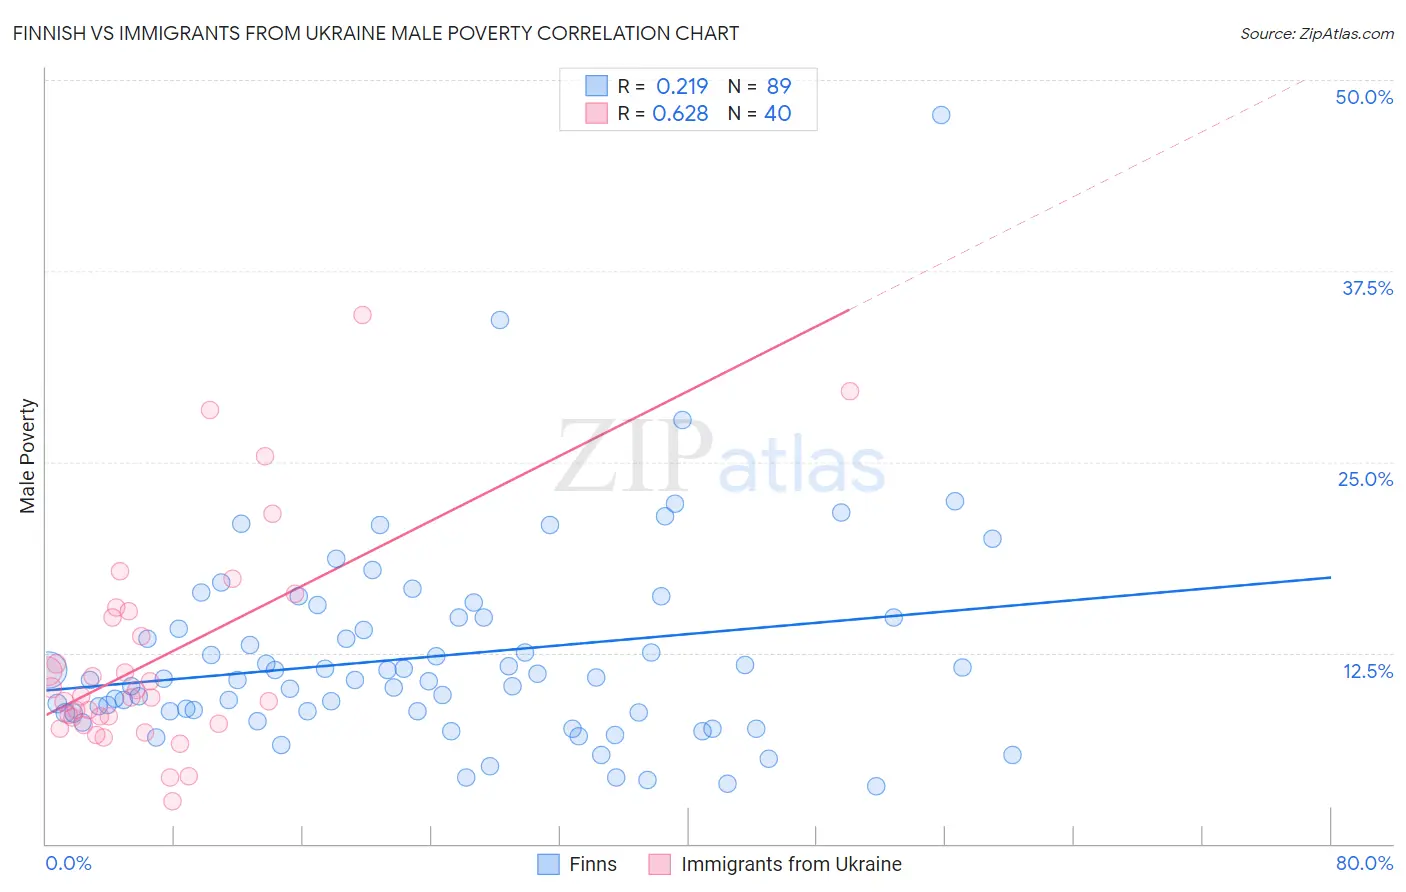
Finnish vs Immigrants from Ukraine Male Poverty Correlation Chart
The statistical analysis conducted on geographies consisting of 404,315,970 people shows a weak positive correlation between the proportion of Finns and poverty level among males in the United States with a correlation coefficient (R) of 0.219 and weighted average of 10.5%. Similarly, the statistical analysis conducted on geographies consisting of 289,574,436 people shows a significant positive correlation between the proportion of Immigrants from Ukraine and poverty level among males in the United States with a correlation coefficient (R) of 0.628 and weighted average of 10.7%, a difference of 2.5%.
Male Poverty Correlation Summary
| Measurement | Finnish | Immigrants from Ukraine |
| Minimum | 3.8% | 2.8% |
| Maximum | 47.7% | 34.6% |
| Range | 43.9% | 31.8% |
| Mean | 12.3% | 12.2% |
| Median | 10.8% | 9.6% |
| Interquartile 25% (IQ1) | 8.6% | 8.1% |
| Interquartile 75% (IQ3) | 14.8% | 15.0% |
| Interquartile Range (IQR) | 6.3% | 6.9% |
| Standard Deviation (Sample) | 6.6% | 7.1% |
| Standard Deviation (Population) | 6.6% | 7.0% |
Similar Demographics by Male Poverty
Demographics Similar to Finns by Male Poverty
In terms of male poverty, the demographic groups most similar to Finns are Romanian (10.5%, a difference of 0.060%), Immigrants from Indonesia (10.5%, a difference of 0.060%), Immigrants from Egypt (10.4%, a difference of 0.11%), Scottish (10.4%, a difference of 0.24%), and Immigrants from South Africa (10.4%, a difference of 0.28%).
| Demographics | Rating | Rank | Male Poverty |
| British | 94.8 /100 | #91 | Exceptional 10.4% |
| Jordanians | 94.4 /100 | #92 | Exceptional 10.4% |
| Australians | 94.4 /100 | #93 | Exceptional 10.4% |
| Immigrants | South Africa | 94.1 /100 | #94 | Exceptional 10.4% |
| Scottish | 94.0 /100 | #95 | Exceptional 10.4% |
| Immigrants | Egypt | 93.7 /100 | #96 | Exceptional 10.4% |
| Romanians | 93.6 /100 | #97 | Exceptional 10.5% |
| Finns | 93.4 /100 | #98 | Exceptional 10.5% |
| Immigrants | Indonesia | 93.3 /100 | #99 | Exceptional 10.5% |
| Immigrants | Latvia | 92.8 /100 | #100 | Exceptional 10.5% |
| Immigrants | Zimbabwe | 92.0 /100 | #101 | Exceptional 10.5% |
| French Canadians | 91.9 /100 | #102 | Exceptional 10.5% |
| Slavs | 91.7 /100 | #103 | Exceptional 10.5% |
| Welsh | 91.6 /100 | #104 | Exceptional 10.5% |
| Canadians | 91.6 /100 | #105 | Exceptional 10.5% |
Demographics Similar to Immigrants from Ukraine by Male Poverty
In terms of male poverty, the demographic groups most similar to Immigrants from Ukraine are Puget Sound Salish (10.7%, a difference of 0.0%), Immigrants from Western Europe (10.7%, a difference of 0.020%), Immigrants from Peru (10.7%, a difference of 0.030%), Chilean (10.7%, a difference of 0.080%), and Immigrants from Belarus (10.7%, a difference of 0.19%).
| Demographics | Rating | Rank | Male Poverty |
| Immigrants | Hungary | 87.6 /100 | #119 | Excellent 10.7% |
| Immigrants | China | 87.1 /100 | #120 | Excellent 10.7% |
| Peruvians | 87.1 /100 | #121 | Excellent 10.7% |
| Native Hawaiians | 87.0 /100 | #122 | Excellent 10.7% |
| South Africans | 86.8 /100 | #123 | Excellent 10.7% |
| French | 86.7 /100 | #124 | Excellent 10.7% |
| Immigrants | Norway | 86.0 /100 | #125 | Excellent 10.7% |
| Immigrants | Ukraine | 84.3 /100 | #126 | Excellent 10.7% |
| Puget Sound Salish | 84.3 /100 | #127 | Excellent 10.7% |
| Immigrants | Western Europe | 84.2 /100 | #128 | Excellent 10.7% |
| Immigrants | Peru | 84.1 /100 | #129 | Excellent 10.7% |
| Chileans | 83.9 /100 | #130 | Excellent 10.7% |
| Immigrants | Belarus | 83.3 /100 | #131 | Excellent 10.7% |
| Immigrants | Vietnam | 83.0 /100 | #132 | Excellent 10.8% |
| Pakistanis | 83.0 /100 | #133 | Excellent 10.8% |