Finnish vs Dutch West Indian Self-Care Disability
COMPARE
Finnish
Dutch West Indian
Self-Care Disability
Self-Care Disability Comparison
Finns
Dutch West Indians
2.4%
SELF-CARE DISABILITY
67.0/ 100
METRIC RATING
160th/ 347
METRIC RANK
3.0%
SELF-CARE DISABILITY
0.0/ 100
METRIC RATING
333rd/ 347
METRIC RANK
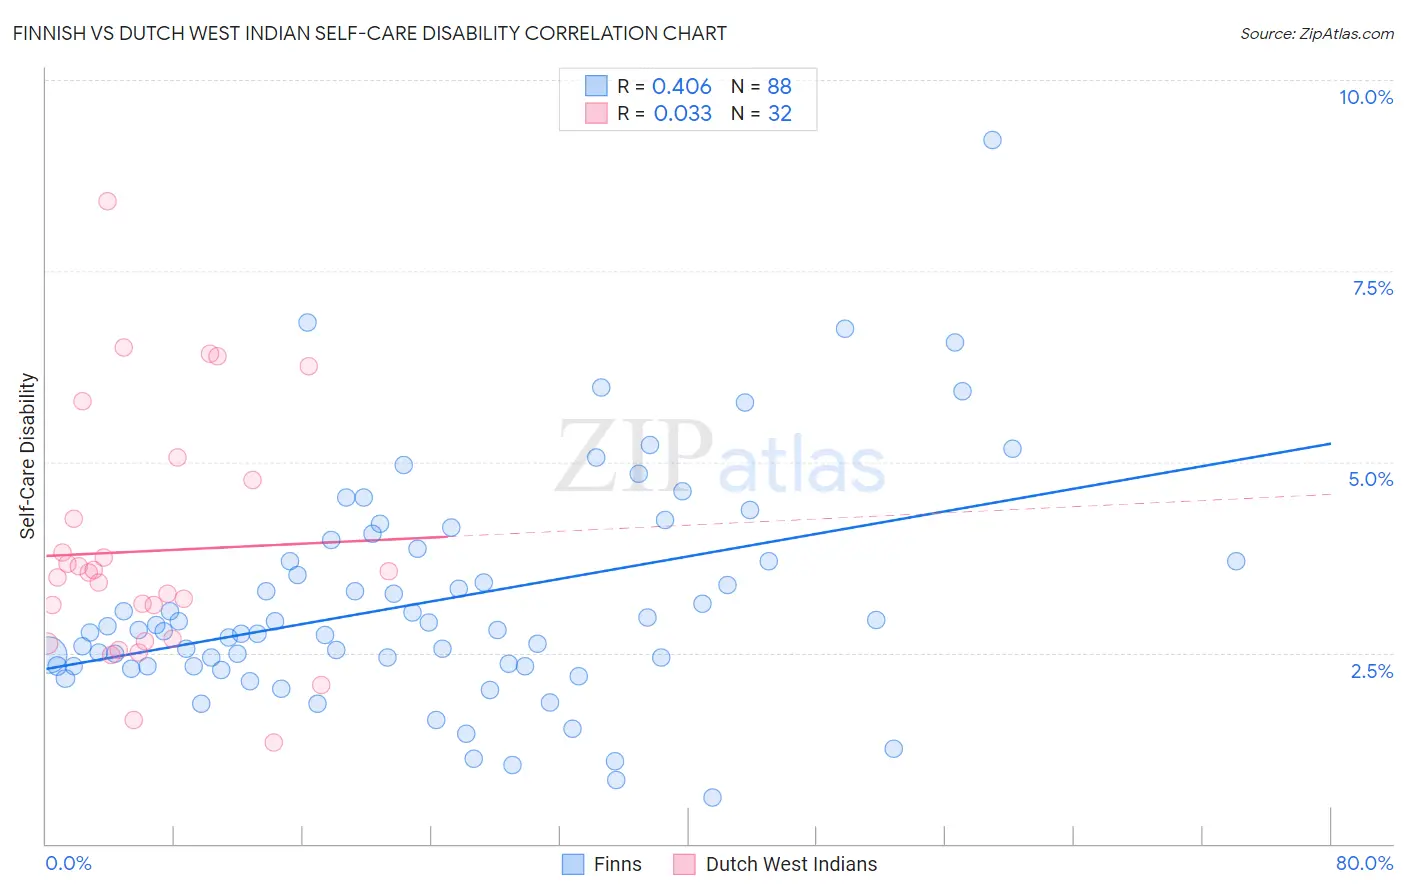
Finnish vs Dutch West Indian Self-Care Disability Correlation Chart
The statistical analysis conducted on geographies consisting of 404,111,559 people shows a moderate positive correlation between the proportion of Finns and percentage of population with self-care disability in the United States with a correlation coefficient (R) of 0.406 and weighted average of 2.4%. Similarly, the statistical analysis conducted on geographies consisting of 85,744,366 people shows no correlation between the proportion of Dutch West Indians and percentage of population with self-care disability in the United States with a correlation coefficient (R) of 0.033 and weighted average of 3.0%, a difference of 22.0%.
Self-Care Disability Correlation Summary
| Measurement | Finnish | Dutch West Indian |
| Minimum | 0.60% | 1.3% |
| Maximum | 9.2% | 8.4% |
| Range | 8.6% | 7.1% |
| Mean | 3.2% | 3.8% |
| Median | 2.8% | 3.5% |
| Interquartile 25% (IQ1) | 2.3% | 2.7% |
| Interquartile 75% (IQ3) | 3.8% | 4.5% |
| Interquartile Range (IQR) | 1.5% | 1.8% |
| Standard Deviation (Sample) | 1.5% | 1.6% |
| Standard Deviation (Population) | 1.5% | 1.6% |
Similar Demographics by Self-Care Disability
Demographics Similar to Finns by Self-Care Disability
In terms of self-care disability, the demographic groups most similar to Finns are Lebanese (2.4%, a difference of 0.030%), Immigrants from Italy (2.4%, a difference of 0.080%), Immigrants from Western Europe (2.4%, a difference of 0.090%), Immigrants from Europe (2.4%, a difference of 0.14%), and Somali (2.5%, a difference of 0.17%).
| Demographics | Rating | Rank | Self-Care Disability |
| Immigrants | England | 73.5 /100 | #153 | Good 2.4% |
| Italians | 72.2 /100 | #154 | Good 2.4% |
| Pakistanis | 71.4 /100 | #155 | Good 2.4% |
| Nigerians | 70.6 /100 | #156 | Good 2.4% |
| Immigrants | Europe | 69.6 /100 | #157 | Good 2.4% |
| Immigrants | Western Europe | 68.6 /100 | #158 | Good 2.4% |
| Immigrants | Italy | 68.5 /100 | #159 | Good 2.4% |
| Finns | 67.0 /100 | #160 | Good 2.4% |
| Lebanese | 66.5 /100 | #161 | Good 2.4% |
| Somalis | 63.7 /100 | #162 | Good 2.5% |
| German Russians | 62.7 /100 | #163 | Good 2.5% |
| Immigrants | Vietnam | 59.3 /100 | #164 | Average 2.5% |
| Syrians | 59.0 /100 | #165 | Average 2.5% |
| Canadians | 58.8 /100 | #166 | Average 2.5% |
| Immigrants | Greece | 57.3 /100 | #167 | Average 2.5% |
Demographics Similar to Dutch West Indians by Self-Care Disability
In terms of self-care disability, the demographic groups most similar to Dutch West Indians are Houma (3.0%, a difference of 0.070%), Immigrants from the Azores (3.0%, a difference of 0.12%), Kiowa (3.0%, a difference of 0.23%), Immigrants from Yemen (3.0%, a difference of 0.28%), and Lumbee (3.0%, a difference of 0.59%).
| Demographics | Rating | Rank | Self-Care Disability |
| Paiute | 0.0 /100 | #326 | Tragic 2.9% |
| Blacks/African Americans | 0.0 /100 | #327 | Tragic 2.9% |
| Hopi | 0.0 /100 | #328 | Tragic 2.9% |
| Cajuns | 0.0 /100 | #329 | Tragic 2.9% |
| Nepalese | 0.0 /100 | #330 | Tragic 3.0% |
| Lumbee | 0.0 /100 | #331 | Tragic 3.0% |
| Kiowa | 0.0 /100 | #332 | Tragic 3.0% |
| Dutch West Indians | 0.0 /100 | #333 | Tragic 3.0% |
| Houma | 0.0 /100 | #334 | Tragic 3.0% |
| Immigrants | Azores | 0.0 /100 | #335 | Tragic 3.0% |
| Immigrants | Yemen | 0.0 /100 | #336 | Tragic 3.0% |
| Choctaw | 0.0 /100 | #337 | Tragic 3.0% |
| Cape Verdeans | 0.0 /100 | #338 | Tragic 3.0% |
| Immigrants | Dominican Republic | 0.0 /100 | #339 | Tragic 3.0% |
| Immigrants | Cabo Verde | 0.0 /100 | #340 | Tragic 3.1% |