Filipino vs Mexican American Indian Female Poverty Among 25-34 Year Olds
COMPARE
Filipino
Mexican American Indian
Female Poverty Among 25-34 Year Olds
Female Poverty Among 25-34 Year Olds Comparison
Filipinos
Mexican American Indians
10.2%
FEMALE POVERTY AMONG 25-34 YEAR OLDS
100.0/ 100
METRIC RATING
3rd/ 347
METRIC RANK
15.4%
FEMALE POVERTY AMONG 25-34 YEAR OLDS
0.2/ 100
METRIC RATING
263rd/ 347
METRIC RANK
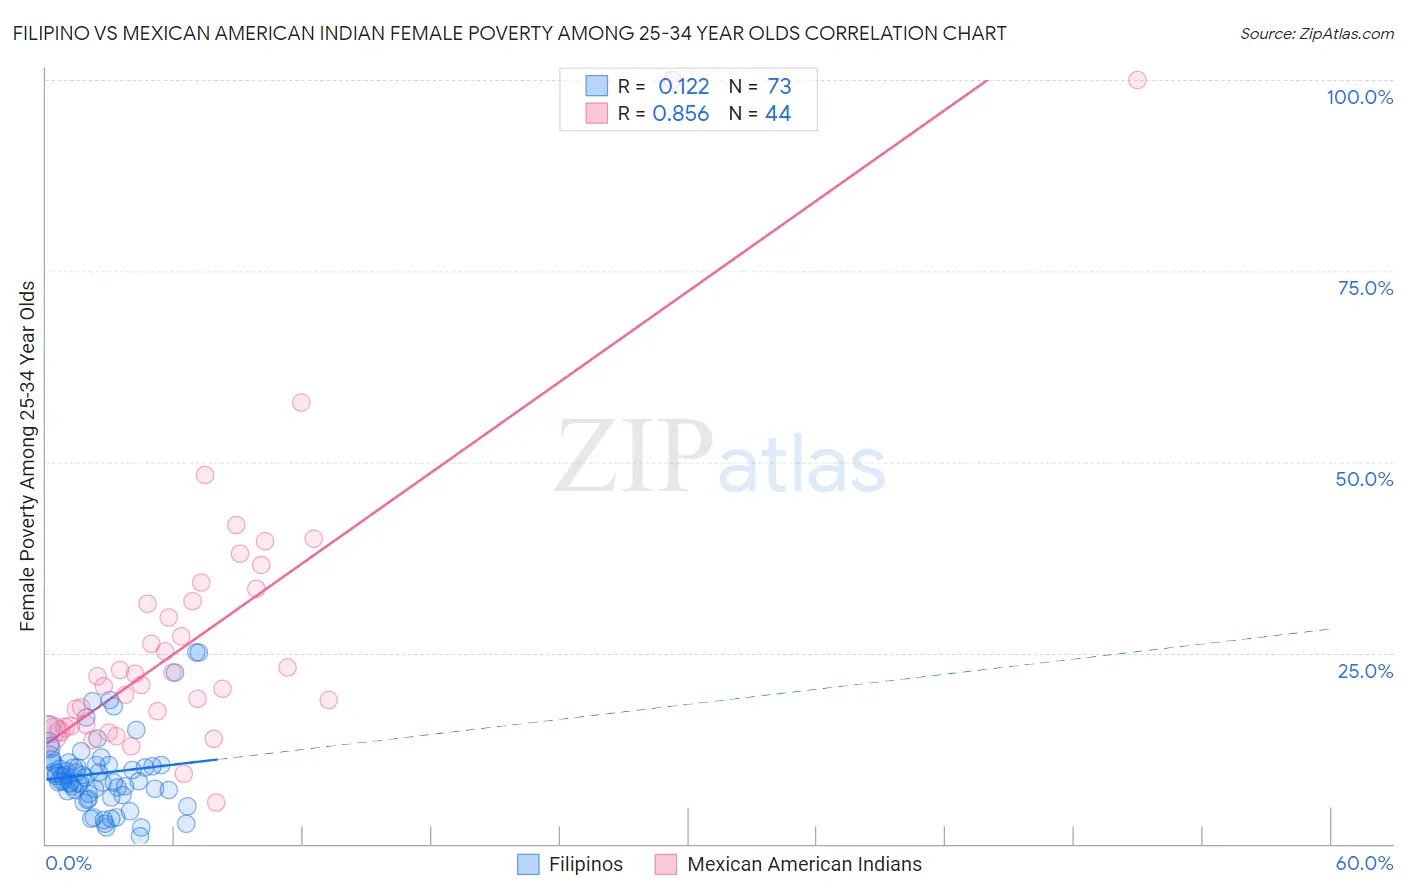
Filipino vs Mexican American Indian Female Poverty Among 25-34 Year Olds Correlation Chart
The statistical analysis conducted on geographies consisting of 251,206,998 people shows a poor positive correlation between the proportion of Filipinos and poverty level among females between the ages 25 and 34 in the United States with a correlation coefficient (R) of 0.122 and weighted average of 10.2%. Similarly, the statistical analysis conducted on geographies consisting of 315,662,807 people shows a very strong positive correlation between the proportion of Mexican American Indians and poverty level among females between the ages 25 and 34 in the United States with a correlation coefficient (R) of 0.856 and weighted average of 15.4%, a difference of 50.3%.
Female Poverty Among 25-34 Year Olds Correlation Summary
| Measurement | Filipino | Mexican American Indian |
| Minimum | 1.0% | 5.3% |
| Maximum | 25.0% | 100.0% |
| Range | 24.0% | 94.7% |
| Mean | 9.2% | 27.2% |
| Median | 8.7% | 21.4% |
| Interquartile 25% (IQ1) | 6.8% | 15.4% |
| Interquartile 75% (IQ3) | 10.5% | 32.6% |
| Interquartile Range (IQR) | 3.7% | 17.2% |
| Standard Deviation (Sample) | 4.9% | 19.4% |
| Standard Deviation (Population) | 4.8% | 19.2% |
Similar Demographics by Female Poverty Among 25-34 Year Olds
Demographics Similar to Filipinos by Female Poverty Among 25-34 Year Olds
In terms of female poverty among 25-34 year olds, the demographic groups most similar to Filipinos are Thai (10.2%, a difference of 0.17%), Immigrants from Hong Kong (10.4%, a difference of 1.5%), Immigrants from Taiwan (10.0%, a difference of 2.1%), Immigrants from India (9.7%, a difference of 5.2%), and Immigrants from South Central Asia (10.8%, a difference of 5.3%).
| Demographics | Rating | Rank | Female Poverty Among 25-34 Year Olds |
| Immigrants | India | 100.0 /100 | #1 | Exceptional 9.7% |
| Immigrants | Taiwan | 100.0 /100 | #2 | Exceptional 10.0% |
| Filipinos | 100.0 /100 | #3 | Exceptional 10.2% |
| Thais | 100.0 /100 | #4 | Exceptional 10.2% |
| Immigrants | Hong Kong | 100.0 /100 | #5 | Exceptional 10.4% |
| Immigrants | South Central Asia | 100.0 /100 | #6 | Exceptional 10.8% |
| Chinese | 100.0 /100 | #7 | Exceptional 11.0% |
| Immigrants | Iran | 100.0 /100 | #8 | Exceptional 11.0% |
| Immigrants | Singapore | 100.0 /100 | #9 | Exceptional 11.1% |
| Immigrants | Lithuania | 100.0 /100 | #10 | Exceptional 11.1% |
| Immigrants | Korea | 100.0 /100 | #11 | Exceptional 11.1% |
| Immigrants | Ireland | 100.0 /100 | #12 | Exceptional 11.2% |
| Burmese | 100.0 /100 | #13 | Exceptional 11.2% |
| Indians (Asian) | 100.0 /100 | #14 | Exceptional 11.2% |
| Assyrians/Chaldeans/Syriacs | 100.0 /100 | #15 | Exceptional 11.2% |
Demographics Similar to Mexican American Indians by Female Poverty Among 25-34 Year Olds
In terms of female poverty among 25-34 year olds, the demographic groups most similar to Mexican American Indians are Immigrants from Belize (15.3%, a difference of 0.24%), Liberian (15.3%, a difference of 0.28%), Pennsylvania German (15.4%, a difference of 0.43%), Immigrants from Liberia (15.4%, a difference of 0.47%), and Immigrants from Somalia (15.4%, a difference of 0.48%).
| Demographics | Rating | Rank | Female Poverty Among 25-34 Year Olds |
| West Indians | 0.3 /100 | #256 | Tragic 15.2% |
| Immigrants | Burma/Myanmar | 0.3 /100 | #257 | Tragic 15.2% |
| Nepalese | 0.2 /100 | #258 | Tragic 15.2% |
| Immigrants | Cuba | 0.2 /100 | #259 | Tragic 15.2% |
| Marshallese | 0.2 /100 | #260 | Tragic 15.3% |
| Liberians | 0.2 /100 | #261 | Tragic 15.3% |
| Immigrants | Belize | 0.2 /100 | #262 | Tragic 15.3% |
| Mexican American Indians | 0.2 /100 | #263 | Tragic 15.4% |
| Pennsylvania Germans | 0.1 /100 | #264 | Tragic 15.4% |
| Immigrants | Liberia | 0.1 /100 | #265 | Tragic 15.4% |
| Immigrants | Somalia | 0.1 /100 | #266 | Tragic 15.4% |
| Central Americans | 0.1 /100 | #267 | Tragic 15.5% |
| Immigrants | Senegal | 0.1 /100 | #268 | Tragic 15.6% |
| Sub-Saharan Africans | 0.1 /100 | #269 | Tragic 15.6% |
| British West Indians | 0.1 /100 | #270 | Tragic 15.6% |