Immigrants from Honduras vs Immigrants from Pakistan Poverty
COMPARE
Immigrants from Honduras
Immigrants from Pakistan
Poverty
Poverty Comparison
Immigrants from Honduras
Immigrants from Pakistan
16.2%
POVERTY
0.0/ 100
METRIC RATING
320th/ 347
METRIC RANK
10.8%
POVERTY
99.3/ 100
METRIC RATING
39th/ 347
METRIC RANK
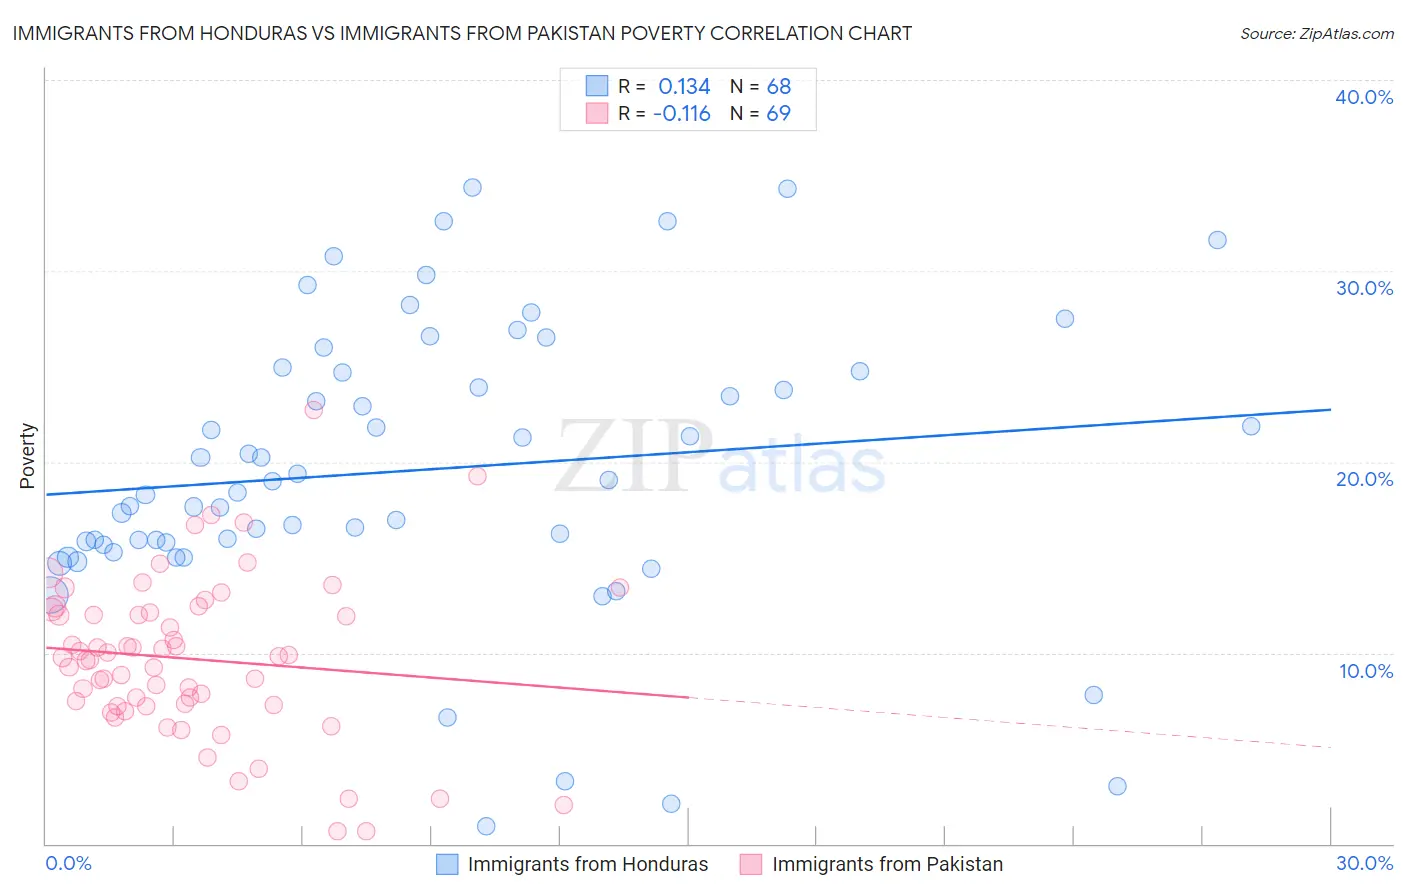
Immigrants from Honduras vs Immigrants from Pakistan Poverty Correlation Chart
The statistical analysis conducted on geographies consisting of 322,477,641 people shows a poor positive correlation between the proportion of Immigrants from Honduras and poverty level in the United States with a correlation coefficient (R) of 0.134 and weighted average of 16.2%. Similarly, the statistical analysis conducted on geographies consisting of 283,811,993 people shows a poor negative correlation between the proportion of Immigrants from Pakistan and poverty level in the United States with a correlation coefficient (R) of -0.116 and weighted average of 10.8%, a difference of 49.1%.
Poverty Correlation Summary
| Measurement | Immigrants from Honduras | Immigrants from Pakistan |
| Minimum | 0.89% | 0.64% |
| Maximum | 34.4% | 22.7% |
| Range | 33.5% | 22.1% |
| Mean | 19.6% | 9.7% |
| Median | 18.7% | 9.8% |
| Interquartile 25% (IQ1) | 15.7% | 7.2% |
| Interquartile 75% (IQ3) | 24.7% | 12.2% |
| Interquartile Range (IQR) | 9.0% | 5.0% |
| Standard Deviation (Sample) | 7.5% | 4.2% |
| Standard Deviation (Population) | 7.4% | 4.1% |
Similar Demographics by Poverty
Demographics Similar to Immigrants from Honduras by Poverty
In terms of poverty, the demographic groups most similar to Immigrants from Honduras are Immigrants from Congo (16.1%, a difference of 0.23%), Immigrants from Dominica (16.1%, a difference of 0.43%), U.S. Virgin Islander (16.1%, a difference of 0.72%), Arapaho (16.3%, a difference of 0.74%), and Menominee (16.4%, a difference of 1.7%).
| Demographics | Rating | Rank | Poverty |
| Immigrants | Grenada | 0.0 /100 | #313 | Tragic 15.8% |
| Immigrants | Somalia | 0.0 /100 | #314 | Tragic 15.8% |
| British West Indians | 0.0 /100 | #315 | Tragic 15.9% |
| Hondurans | 0.0 /100 | #316 | Tragic 15.9% |
| U.S. Virgin Islanders | 0.0 /100 | #317 | Tragic 16.1% |
| Immigrants | Dominica | 0.0 /100 | #318 | Tragic 16.1% |
| Immigrants | Congo | 0.0 /100 | #319 | Tragic 16.1% |
| Immigrants | Honduras | 0.0 /100 | #320 | Tragic 16.2% |
| Arapaho | 0.0 /100 | #321 | Tragic 16.3% |
| Menominee | 0.0 /100 | #322 | Tragic 16.4% |
| Colville | 0.0 /100 | #323 | Tragic 16.6% |
| Yakama | 0.0 /100 | #324 | Tragic 16.7% |
| Central American Indians | 0.0 /100 | #325 | Tragic 16.7% |
| Paiute | 0.0 /100 | #326 | Tragic 16.7% |
| Kiowa | 0.0 /100 | #327 | Tragic 16.8% |
Demographics Similar to Immigrants from Pakistan by Poverty
In terms of poverty, the demographic groups most similar to Immigrants from Pakistan are Russian (10.9%, a difference of 0.050%), Czech (10.8%, a difference of 0.080%), Immigrants from Greece (10.8%, a difference of 0.13%), Immigrants from Iran (10.9%, a difference of 0.14%), and Cypriot (10.8%, a difference of 0.22%).
| Demographics | Rating | Rank | Poverty |
| Iranians | 99.5 /100 | #32 | Exceptional 10.7% |
| Macedonians | 99.4 /100 | #33 | Exceptional 10.8% |
| Immigrants | Poland | 99.4 /100 | #34 | Exceptional 10.8% |
| Tongans | 99.4 /100 | #35 | Exceptional 10.8% |
| Cypriots | 99.3 /100 | #36 | Exceptional 10.8% |
| Immigrants | Greece | 99.3 /100 | #37 | Exceptional 10.8% |
| Czechs | 99.3 /100 | #38 | Exceptional 10.8% |
| Immigrants | Pakistan | 99.3 /100 | #39 | Exceptional 10.8% |
| Russians | 99.3 /100 | #40 | Exceptional 10.9% |
| Immigrants | Iran | 99.2 /100 | #41 | Exceptional 10.9% |
| Koreans | 99.2 /100 | #42 | Exceptional 10.9% |
| Immigrants | Singapore | 99.2 /100 | #43 | Exceptional 10.9% |
| Immigrants | Moldova | 99.1 /100 | #44 | Exceptional 10.9% |
| Turks | 98.9 /100 | #45 | Exceptional 11.0% |
| Immigrants | Czechoslovakia | 98.9 /100 | #46 | Exceptional 11.0% |