Fijian vs Immigrants from Syria Single Female Poverty
COMPARE
Fijian
Immigrants from Syria
Single Female Poverty
Single Female Poverty Comparison
Fijians
Immigrants from Syria
23.1%
SINGLE FEMALE POVERTY
0.2/ 100
METRIC RATING
268th/ 347
METRIC RANK
19.9%
SINGLE FEMALE POVERTY
96.7/ 100
METRIC RATING
107th/ 347
METRIC RANK
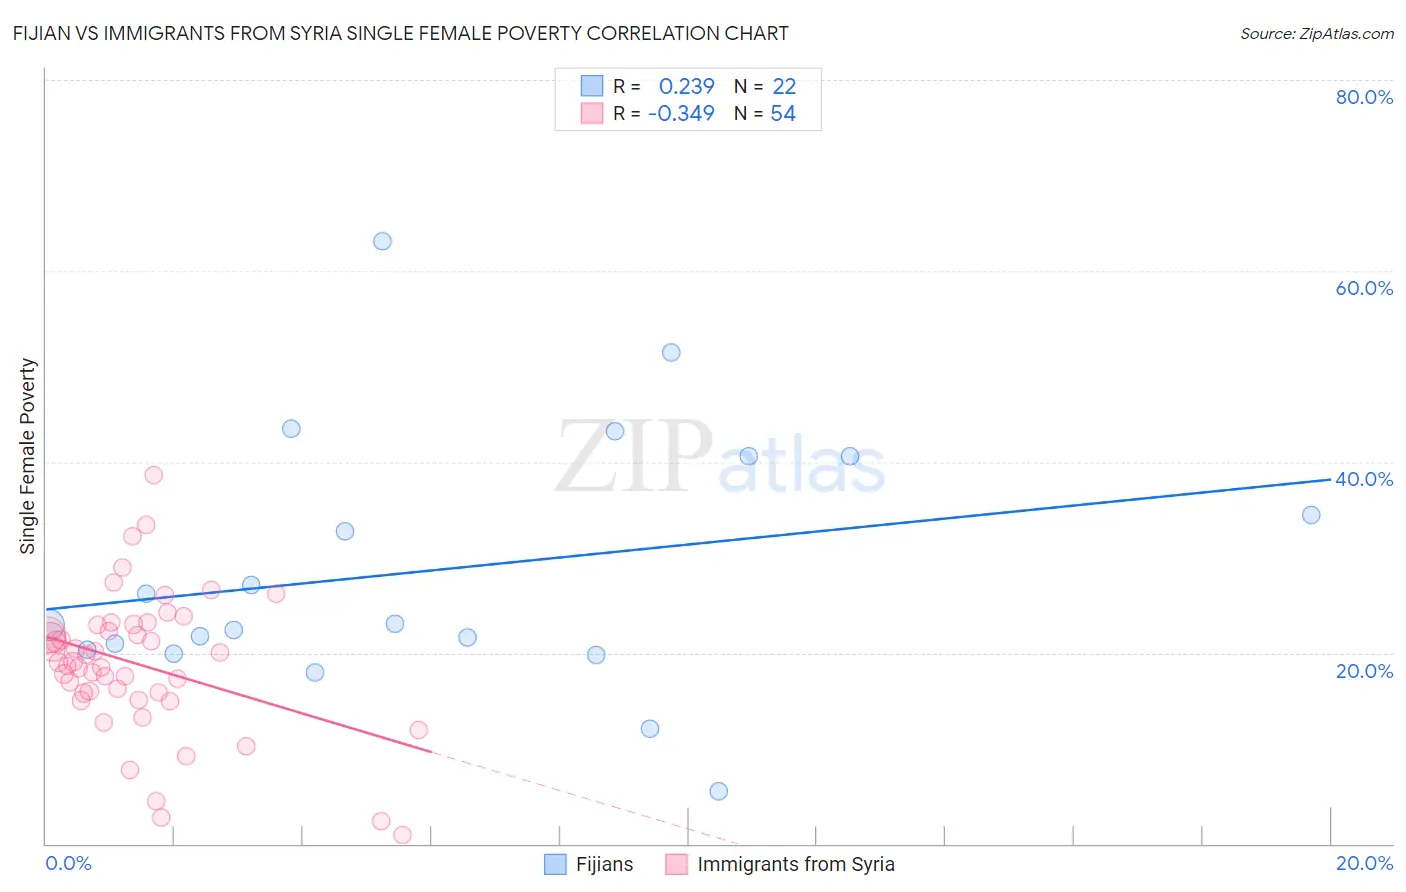
Fijian vs Immigrants from Syria Single Female Poverty Correlation Chart
The statistical analysis conducted on geographies consisting of 55,892,814 people shows a weak positive correlation between the proportion of Fijians and poverty level among single females in the United States with a correlation coefficient (R) of 0.239 and weighted average of 23.1%. Similarly, the statistical analysis conducted on geographies consisting of 173,058,161 people shows a mild negative correlation between the proportion of Immigrants from Syria and poverty level among single females in the United States with a correlation coefficient (R) of -0.349 and weighted average of 19.9%, a difference of 15.9%.
Single Female Poverty Correlation Summary
| Measurement | Fijian | Immigrants from Syria |
| Minimum | 5.6% | 0.97% |
| Maximum | 63.2% | 38.6% |
| Range | 57.6% | 37.6% |
| Mean | 28.7% | 18.8% |
| Median | 23.0% | 19.0% |
| Interquartile 25% (IQ1) | 20.3% | 15.8% |
| Interquartile 75% (IQ3) | 40.6% | 22.9% |
| Interquartile Range (IQR) | 20.3% | 7.1% |
| Standard Deviation (Sample) | 13.6% | 7.4% |
| Standard Deviation (Population) | 13.3% | 7.3% |
Similar Demographics by Single Female Poverty
Demographics Similar to Fijians by Single Female Poverty
In terms of single female poverty, the demographic groups most similar to Fijians are Hmong (23.1%, a difference of 0.030%), Senegalese (23.0%, a difference of 0.070%), Immigrants from Micronesia (23.0%, a difference of 0.13%), Inupiat (23.1%, a difference of 0.28%), and Central American (23.0%, a difference of 0.34%).
| Demographics | Rating | Rank | Single Female Poverty |
| Immigrants | Cabo Verde | 0.4 /100 | #261 | Tragic 22.8% |
| British West Indians | 0.4 /100 | #262 | Tragic 22.8% |
| Scotch-Irish | 0.3 /100 | #263 | Tragic 22.9% |
| Immigrants | Laos | 0.3 /100 | #264 | Tragic 22.9% |
| Central Americans | 0.2 /100 | #265 | Tragic 23.0% |
| Immigrants | Micronesia | 0.2 /100 | #266 | Tragic 23.0% |
| Senegalese | 0.2 /100 | #267 | Tragic 23.0% |
| Fijians | 0.2 /100 | #268 | Tragic 23.1% |
| Hmong | 0.2 /100 | #269 | Tragic 23.1% |
| Inupiat | 0.2 /100 | #270 | Tragic 23.1% |
| Sub-Saharan Africans | 0.1 /100 | #271 | Tragic 23.2% |
| Immigrants | Senegal | 0.1 /100 | #272 | Tragic 23.2% |
| Alaska Natives | 0.1 /100 | #273 | Tragic 23.3% |
| Marshallese | 0.1 /100 | #274 | Tragic 23.3% |
| Mexican American Indians | 0.1 /100 | #275 | Tragic 23.4% |
Demographics Similar to Immigrants from Syria by Single Female Poverty
In terms of single female poverty, the demographic groups most similar to Immigrants from Syria are Ethiopian (19.9%, a difference of 0.020%), Native Hawaiian (19.9%, a difference of 0.050%), Colombian (19.9%, a difference of 0.060%), Immigrants from Western Asia (19.9%, a difference of 0.070%), and Israeli (19.9%, a difference of 0.11%).
| Demographics | Rating | Rank | Single Female Poverty |
| Ukrainians | 97.6 /100 | #100 | Exceptional 19.8% |
| Immigrants | Belgium | 97.3 /100 | #101 | Exceptional 19.8% |
| Immigrants | Cameroon | 97.3 /100 | #102 | Exceptional 19.8% |
| Immigrants | Southern Europe | 97.1 /100 | #103 | Exceptional 19.9% |
| Chileans | 96.9 /100 | #104 | Exceptional 19.9% |
| Israelis | 96.9 /100 | #105 | Exceptional 19.9% |
| Ethiopians | 96.7 /100 | #106 | Exceptional 19.9% |
| Immigrants | Syria | 96.7 /100 | #107 | Exceptional 19.9% |
| Native Hawaiians | 96.6 /100 | #108 | Exceptional 19.9% |
| Colombians | 96.6 /100 | #109 | Exceptional 19.9% |
| Immigrants | Western Asia | 96.5 /100 | #110 | Exceptional 19.9% |
| Carpatho Rusyns | 96.1 /100 | #111 | Exceptional 20.0% |
| Immigrants | Netherlands | 96.0 /100 | #112 | Exceptional 20.0% |
| Immigrants | Zimbabwe | 95.9 /100 | #113 | Exceptional 20.0% |
| Immigrants | Colombia | 95.9 /100 | #114 | Exceptional 20.0% |