European vs Nigerian Single Male Poverty
COMPARE
European
Nigerian
Single Male Poverty
Single Male Poverty Comparison
Europeans
Nigerians
13.3%
SINGLE MALE POVERTY
6.2/ 100
METRIC RATING
229th/ 347
METRIC RANK
12.9%
SINGLE MALE POVERTY
31.9/ 100
METRIC RATING
186th/ 347
METRIC RANK
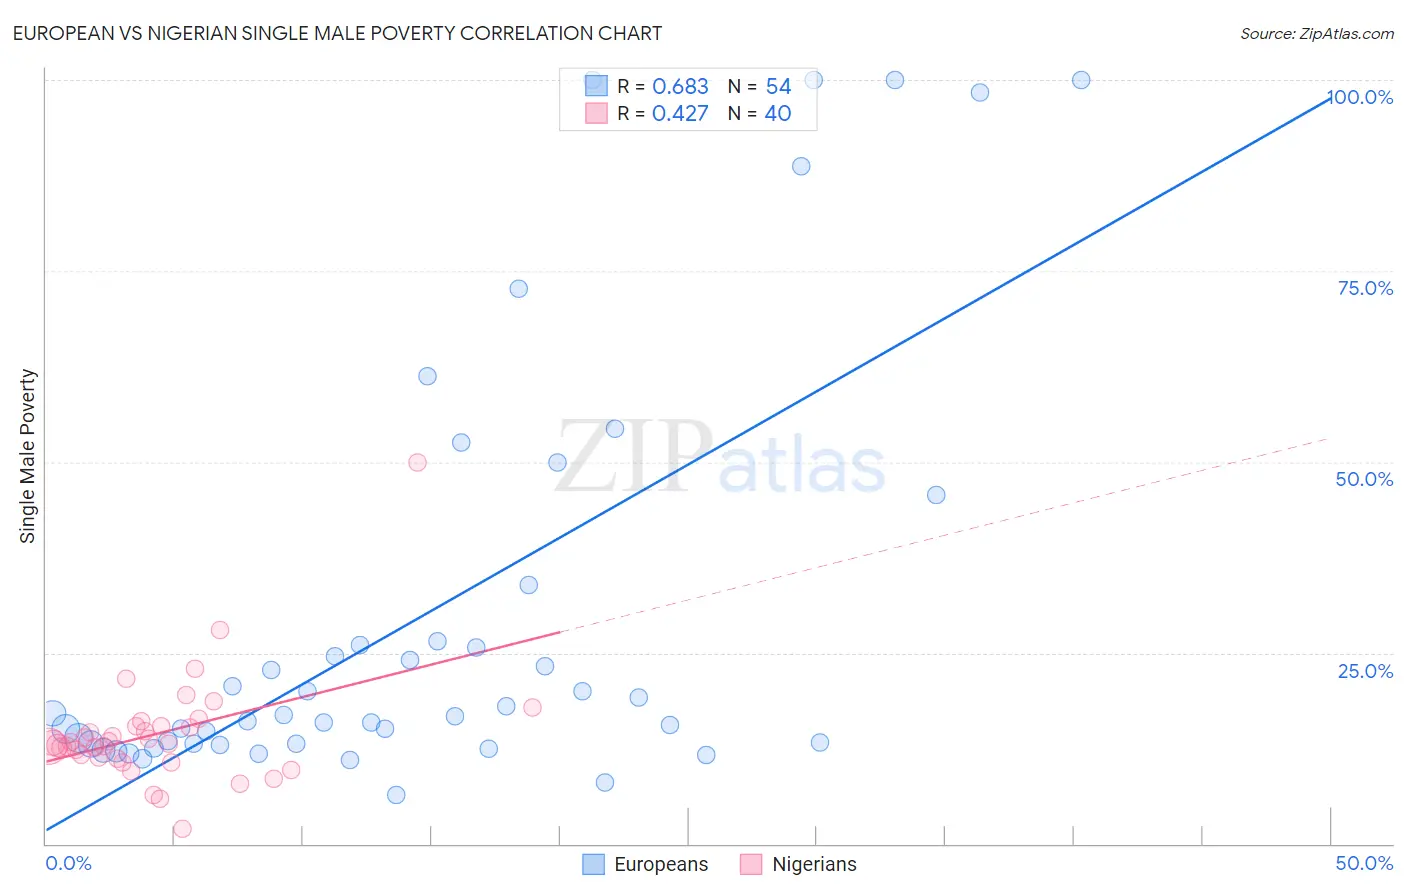
European vs Nigerian Single Male Poverty Correlation Chart
The statistical analysis conducted on geographies consisting of 466,343,596 people shows a significant positive correlation between the proportion of Europeans and poverty level among single males in the United States with a correlation coefficient (R) of 0.683 and weighted average of 13.3%. Similarly, the statistical analysis conducted on geographies consisting of 304,027,429 people shows a moderate positive correlation between the proportion of Nigerians and poverty level among single males in the United States with a correlation coefficient (R) of 0.427 and weighted average of 12.9%, a difference of 2.6%.
Single Male Poverty Correlation Summary
| Measurement | European | Nigerian |
| Minimum | 6.4% | 1.9% |
| Maximum | 100.0% | 50.0% |
| Range | 93.6% | 48.1% |
| Mean | 29.9% | 14.4% |
| Median | 16.8% | 13.2% |
| Interquartile 25% (IQ1) | 13.1% | 11.2% |
| Interquartile 75% (IQ3) | 26.5% | 15.4% |
| Interquartile Range (IQR) | 13.3% | 4.2% |
| Standard Deviation (Sample) | 27.9% | 7.4% |
| Standard Deviation (Population) | 27.6% | 7.3% |
Similar Demographics by Single Male Poverty
Demographics Similar to Europeans by Single Male Poverty
In terms of single male poverty, the demographic groups most similar to Europeans are Ghanaian (13.3%, a difference of 0.030%), Lebanese (13.2%, a difference of 0.090%), Haitian (13.2%, a difference of 0.17%), Slavic (13.3%, a difference of 0.20%), and Immigrants from Caribbean (13.3%, a difference of 0.30%).
| Demographics | Rating | Rank | Single Male Poverty |
| Immigrants | Western Europe | 10.0 /100 | #222 | Poor 13.2% |
| Immigrants | Azores | 9.3 /100 | #223 | Tragic 13.2% |
| Somalis | 9.1 /100 | #224 | Tragic 13.2% |
| Immigrants | Denmark | 8.7 /100 | #225 | Tragic 13.2% |
| Jamaicans | 7.7 /100 | #226 | Tragic 13.2% |
| Haitians | 7.0 /100 | #227 | Tragic 13.2% |
| Lebanese | 6.6 /100 | #228 | Tragic 13.2% |
| Europeans | 6.2 /100 | #229 | Tragic 13.3% |
| Ghanaians | 6.1 /100 | #230 | Tragic 13.3% |
| Slavs | 5.3 /100 | #231 | Tragic 13.3% |
| Immigrants | Caribbean | 5.0 /100 | #232 | Tragic 13.3% |
| British | 4.0 /100 | #233 | Tragic 13.3% |
| Canadians | 4.0 /100 | #234 | Tragic 13.3% |
| Bangladeshis | 3.7 /100 | #235 | Tragic 13.3% |
| Luxembourgers | 3.6 /100 | #236 | Tragic 13.4% |
Demographics Similar to Nigerians by Single Male Poverty
In terms of single male poverty, the demographic groups most similar to Nigerians are Norwegian (12.9%, a difference of 0.0%), Immigrants from Kuwait (12.9%, a difference of 0.0%), Immigrants from Trinidad and Tobago (12.9%, a difference of 0.030%), Macedonian (12.9%, a difference of 0.030%), and Immigrants from West Indies (12.9%, a difference of 0.060%).
| Demographics | Rating | Rank | Single Male Poverty |
| Israelis | 41.0 /100 | #179 | Average 12.9% |
| Immigrants | North America | 37.7 /100 | #180 | Fair 12.9% |
| Panamanians | 37.6 /100 | #181 | Fair 12.9% |
| Moroccans | 36.8 /100 | #182 | Fair 12.9% |
| Immigrants | West Indies | 33.0 /100 | #183 | Fair 12.9% |
| Immigrants | Trinidad and Tobago | 32.5 /100 | #184 | Fair 12.9% |
| Norwegians | 32.0 /100 | #185 | Fair 12.9% |
| Nigerians | 31.9 /100 | #186 | Fair 12.9% |
| Immigrants | Kuwait | 31.9 /100 | #187 | Fair 12.9% |
| Macedonians | 31.5 /100 | #188 | Fair 12.9% |
| Portuguese | 30.2 /100 | #189 | Fair 12.9% |
| Arabs | 27.0 /100 | #190 | Fair 13.0% |
| Immigrants | Thailand | 26.6 /100 | #191 | Fair 13.0% |
| Immigrants | Jamaica | 26.5 /100 | #192 | Fair 13.0% |
| Immigrants | South Africa | 26.1 /100 | #193 | Fair 13.0% |