Estonian vs Immigrants from Eritrea Hearing Disability
COMPARE
Estonian
Immigrants from Eritrea
Hearing Disability
Hearing Disability Comparison
Estonians
Immigrants from Eritrea
3.3%
HEARING DISABILITY
2.4/ 100
METRIC RATING
233rd/ 347
METRIC RANK
2.7%
HEARING DISABILITY
98.5/ 100
METRIC RATING
59th/ 347
METRIC RANK
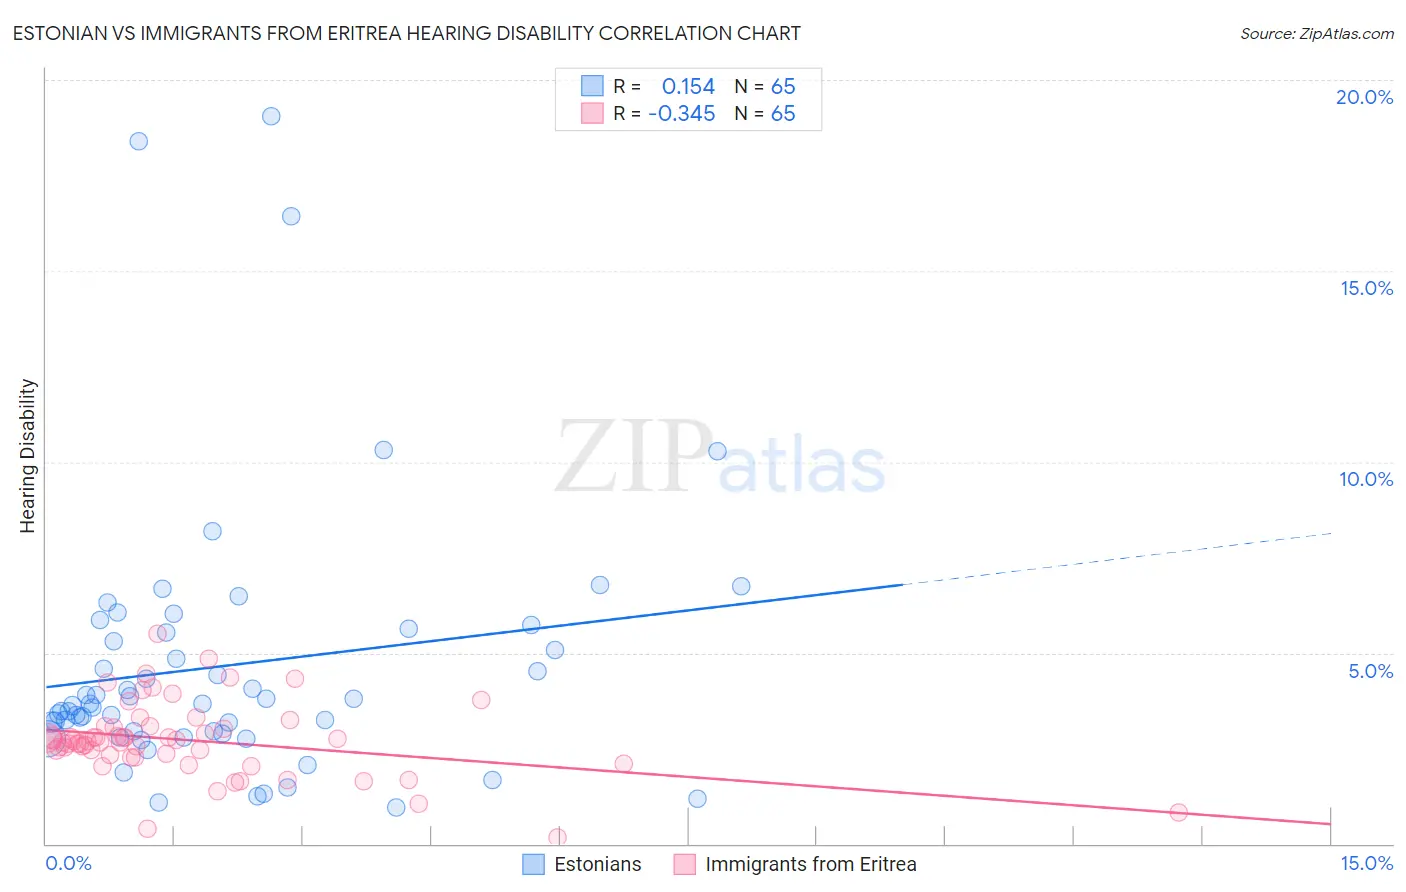
Estonian vs Immigrants from Eritrea Hearing Disability Correlation Chart
The statistical analysis conducted on geographies consisting of 123,522,478 people shows a poor positive correlation between the proportion of Estonians and percentage of population with hearing disability in the United States with a correlation coefficient (R) of 0.154 and weighted average of 3.3%. Similarly, the statistical analysis conducted on geographies consisting of 104,850,181 people shows a mild negative correlation between the proportion of Immigrants from Eritrea and percentage of population with hearing disability in the United States with a correlation coefficient (R) of -0.345 and weighted average of 2.7%, a difference of 20.6%.
Hearing Disability Correlation Summary
| Measurement | Estonian | Immigrants from Eritrea |
| Minimum | 0.96% | 0.17% |
| Maximum | 19.0% | 5.5% |
| Range | 18.1% | 5.3% |
| Mean | 4.7% | 2.7% |
| Median | 3.7% | 2.7% |
| Interquartile 25% (IQ1) | 2.9% | 2.3% |
| Interquartile 75% (IQ3) | 5.6% | 3.0% |
| Interquartile Range (IQR) | 2.7% | 0.75% |
| Standard Deviation (Sample) | 3.5% | 0.97% |
| Standard Deviation (Population) | 3.5% | 0.96% |
Similar Demographics by Hearing Disability
Demographics Similar to Estonians by Hearing Disability
In terms of hearing disability, the demographic groups most similar to Estonians are Central American Indian (3.3%, a difference of 0.070%), Guamanian/Chamorro (3.3%, a difference of 0.17%), Serbian (3.3%, a difference of 0.24%), Ukrainian (3.2%, a difference of 0.37%), and Luxembourger (3.2%, a difference of 0.42%).
| Demographics | Rating | Rank | Hearing Disability |
| Lebanese | 5.0 /100 | #226 | Tragic 3.2% |
| Bhutanese | 4.6 /100 | #227 | Tragic 3.2% |
| Immigrants | Portugal | 4.3 /100 | #228 | Tragic 3.2% |
| Maltese | 4.1 /100 | #229 | Tragic 3.2% |
| Greeks | 3.2 /100 | #230 | Tragic 3.2% |
| Luxembourgers | 2.9 /100 | #231 | Tragic 3.2% |
| Ukrainians | 2.9 /100 | #232 | Tragic 3.2% |
| Estonians | 2.4 /100 | #233 | Tragic 3.3% |
| Central American Indians | 2.3 /100 | #234 | Tragic 3.3% |
| Guamanians/Chamorros | 2.2 /100 | #235 | Tragic 3.3% |
| Serbians | 2.2 /100 | #236 | Tragic 3.3% |
| Immigrants | Austria | 1.8 /100 | #237 | Tragic 3.3% |
| German Russians | 1.8 /100 | #238 | Tragic 3.3% |
| Nepalese | 1.2 /100 | #239 | Tragic 3.3% |
| Immigrants | Netherlands | 1.1 /100 | #240 | Tragic 3.3% |
Demographics Similar to Immigrants from Eritrea by Hearing Disability
In terms of hearing disability, the demographic groups most similar to Immigrants from Eritrea are Immigrants from Egypt (2.7%, a difference of 0.070%), Immigrants from Peru (2.7%, a difference of 0.11%), Immigrants from Uzbekistan (2.7%, a difference of 0.20%), Immigrants from Colombia (2.7%, a difference of 0.21%), and Indian (Asian) (2.7%, a difference of 0.26%).
| Demographics | Rating | Rank | Hearing Disability |
| Jamaicans | 99.0 /100 | #52 | Exceptional 2.7% |
| Immigrants | Eastern Asia | 99.0 /100 | #53 | Exceptional 2.7% |
| Ethiopians | 99.0 /100 | #54 | Exceptional 2.7% |
| Immigrants | Ethiopia | 99.0 /100 | #55 | Exceptional 2.7% |
| Immigrants | Nicaragua | 99.0 /100 | #56 | Exceptional 2.7% |
| South Americans | 99.0 /100 | #57 | Exceptional 2.7% |
| Immigrants | Peru | 98.6 /100 | #58 | Exceptional 2.7% |
| Immigrants | Eritrea | 98.5 /100 | #59 | Exceptional 2.7% |
| Immigrants | Egypt | 98.5 /100 | #60 | Exceptional 2.7% |
| Immigrants | Uzbekistan | 98.4 /100 | #61 | Exceptional 2.7% |
| Immigrants | Colombia | 98.4 /100 | #62 | Exceptional 2.7% |
| Indians (Asian) | 98.4 /100 | #63 | Exceptional 2.7% |
| Immigrants | Sri Lanka | 98.4 /100 | #64 | Exceptional 2.7% |
| Immigrants | Nepal | 98.3 /100 | #65 | Exceptional 2.7% |
| Immigrants | Belize | 98.2 /100 | #66 | Exceptional 2.7% |