Estonian vs Immigrants from Eritrea Unemployment Among Youth under 25 years

COMPARE

Estonian
Race
Ancestry
AfghanAfricanAlaska NativeAlaskan AthabascanAlbanianAleutAlsatianAmericanApacheArabArapahoArgentineanArmenianAssyrian/Chaldean/SyriacAustralianAustrianBahamianBangladeshiBarbadianBasqueBelgianBelizeanBermudanBhutaneseBlackfeetBolivianBrazilianBritishBritish West IndianBulgarianBurmeseCajunCambodianCanadianCape VerdeanCarpatho RusynCelticCentral AmericanCentral American IndianCherokeeCheyenneChickasawChileanChineseChippewaChoctawColombianColvilleComancheCosta RicanCreeCreekCroatianCrowCubanCypriotCzechCzechoslovakianDanishDelawareDominicanDutchDutch West IndianEastern EuropeanEcuadorianEgyptianEnglishEstonianEthiopianEuropeanFijianFilipinoFinnishFrenchFrench American IndianFrench CanadianGermanGerman RussianGhanaianGreekGuamanian/ChamorroGuatemalanGuyaneseHaitianHmongHonduranHopiHoumaHungarianIcelanderIndian (Asian)IndonesianInupiatIranianIraqiIrishIroquoisIsraeliItalianJamaicanJapaneseJordanianKenyanKiowaKoreanLaotianLatvianLebaneseLiberianLithuanianLumbeeLuxembourgerMacedonianMalaysianMalteseMarshalleseMenomineeMexicanMexican American IndianMongolianMoroccanNative HawaiianNavajoNepaleseNew ZealanderNicaraguanNigerianNorthern EuropeanNorwegianOkinawanOsageOttawaPaiutePakistaniPalestinianPanamanianParaguayanPennsylvania GermanPeruvianPimaPolishPortuguesePotawatomiPuebloPuerto RicanPuget Sound SalishRomanianRussianSalvadoranSamoanScandinavianScotch-IrishScottishSeminoleSenegaleseSerbianShoshoneSierra LeoneanSiouxSlavicSlovakSloveneSomaliSouth AfricanSouth AmericanSouth American IndianSoviet UnionSpaniardSpanishSpanish AmericanSpanish American IndianSri LankanSubsaharan AfricanSudaneseSwedishSwissSyrianTaiwaneseThaiTlingit-HaidaTohono O'OdhamTonganTrinidadian and TobagonianTsimshianTurkishU.S. Virgin IslanderUgandanUkrainianUruguayanUteVenezuelanVietnameseWelshWest IndianYakamaYaquiYugoslavianYumanYup'ikZimbabwean
Immigration
NonimmigrantsImmigrantsAfghanistanAfricaAlbaniaArgentinaArmeniaAsiaAustraliaAustriaBahamasBangladeshBarbadosBelarusBelgiumBelizeBoliviaBosnia and HerzegovinaBrazilBulgariaBurma/MyanmarCabo VerdeCambodiaCameroonCanadaCaribbeanCentral AmericaChileChinaColombiaCongoCosta RicaCroatiaCubaCzechoslovakiaDenmarkDominicaDominican RepublicEastern AfricaEastern AsiaEastern EuropeEcuadorEgyptEl SalvadorEnglandEthiopiaEuropeFijiFranceGermanyGhanaGreeceGrenadaGuatemalaGuyanaHaitiHondurasHong KongHungaryIndiaIndonesiaIranIraqIrelandIsraelItalyJamaicaJapanJordanKazakhstanKenyaKoreaKuwaitLaosLatin AmericaLatviaLebanonLiberiaLithuaniaMalaysiaMexicoMicronesiaMiddle AfricaMoldovaMoroccoNepalNetherlandsNicaraguaNigeriaNorth AmericaNorth MacedoniaNorthern AfricaNorthern EuropeNorwayOceaniaPakistanPanamaPeruPhilippinesPolandPortugalRomaniaRussiaSaudi ArabiaScotlandSenegalSerbiaSierra LeoneSingaporeSomaliaSouth AfricaSouth AmericaSouth Central AsiaSouth Eastern AsiaSouthern EuropeSpainSri LankaSt. Vincent and the GrenadinesSudanSwedenSwitzerlandSyriaTaiwanThailandTrinidad and TobagoTurkeyUgandaUkraineUruguayUzbekistanVenezuelaVietnamWest IndiesWestern AfricaWestern AsiaWestern EuropeYemenZaireZimbabweAzores
Immigrants from Eritrea
Race
Ancestry
AfghanAfricanAlaska NativeAlaskan AthabascanAlbanianAleutAlsatianAmericanApacheArabArapahoArgentineanArmenianAssyrian/Chaldean/SyriacAustralianAustrianBahamianBangladeshiBarbadianBasqueBelgianBelizeanBermudanBhutaneseBlackfeetBolivianBrazilianBritishBritish West IndianBulgarianBurmeseCajunCambodianCanadianCape VerdeanCarpatho RusynCelticCentral AmericanCentral American IndianCherokeeCheyenneChickasawChileanChineseChippewaChoctawColombianColvilleComancheCosta RicanCreeCreekCroatianCrowCubanCypriotCzechCzechoslovakianDanishDelawareDominicanDutchDutch West IndianEastern EuropeanEcuadorianEgyptianEnglishEthiopianEuropeanFijianFilipinoFinnishFrenchFrench American IndianFrench CanadianGermanGerman RussianGhanaianGreekGuamanian/ChamorroGuatemalanGuyaneseHaitianHmongHonduranHopiHoumaHungarianIcelanderIndian (Asian)IndonesianInupiatIranianIraqiIrishIroquoisIsraeliItalianJamaicanJapaneseJordanianKenyanKiowaKoreanLaotianLatvianLebaneseLiberianLithuanianLumbeeLuxembourgerMacedonianMalaysianMalteseMarshalleseMenomineeMexicanMexican American IndianMongolianMoroccanNative HawaiianNavajoNepaleseNew ZealanderNicaraguanNigerianNorthern EuropeanNorwegianOkinawanOsageOttawaPaiutePakistaniPalestinianPanamanianParaguayanPennsylvania GermanPeruvianPimaPolishPortuguesePotawatomiPuebloPuerto RicanPuget Sound SalishRomanianRussianSalvadoranSamoanScandinavianScotch-IrishScottishSeminoleSenegaleseSerbianShoshoneSierra LeoneanSiouxSlavicSlovakSloveneSomaliSouth AfricanSouth AmericanSouth American IndianSoviet UnionSpaniardSpanishSpanish AmericanSpanish American IndianSri LankanSubsaharan AfricanSudaneseSwedishSwissSyrianTaiwaneseThaiTlingit-HaidaTohono O'OdhamTonganTrinidadian and TobagonianTsimshianTurkishU.S. Virgin IslanderUgandanUkrainianUruguayanUteVenezuelanVietnameseWelshWest IndianYakamaYaquiYugoslavianYumanYup'ikZimbabwean
Immigration
NonimmigrantsImmigrantsAfghanistanAfricaAlbaniaArgentinaArmeniaAsiaAustraliaAustriaBahamasBangladeshBarbadosBelarusBelgiumBelizeBoliviaBosnia and HerzegovinaBrazilBulgariaBurma/MyanmarCabo VerdeCambodiaCameroonCanadaCaribbeanCentral AmericaChileChinaColombiaCongoCosta RicaCroatiaCubaCzechoslovakiaDenmarkDominicaDominican RepublicEastern AfricaEastern AsiaEastern EuropeEcuadorEgyptEl SalvadorEnglandEritreaEthiopiaEuropeFijiFranceGermanyGhanaGreeceGrenadaGuatemalaGuyanaHaitiHondurasHong KongHungaryIndiaIndonesiaIranIraqIrelandIsraelItalyJamaicaJapanJordanKazakhstanKenyaKoreaKuwaitLaosLatin AmericaLatviaLebanonLiberiaLithuaniaMalaysiaMexicoMicronesiaMiddle AfricaMoldovaMoroccoNepalNetherlandsNicaraguaNigeriaNorth AmericaNorth MacedoniaNorthern AfricaNorthern EuropeNorwayOceaniaPakistanPanamaPeruPhilippinesPolandPortugalRomaniaRussiaSaudi ArabiaScotlandSenegalSerbiaSierra LeoneSingaporeSomaliaSouth AfricaSouth AmericaSouth Central AsiaSouth Eastern AsiaSouthern EuropeSpainSri LankaSt. Vincent and the GrenadinesSudanSwedenSwitzerlandSyriaTaiwanThailandTrinidad and TobagoTurkeyUgandaUkraineUruguayUzbekistanVenezuelaVietnamWest IndiesWestern AfricaWestern AsiaWestern EuropeYemenZaireZimbabweAzores
Unemployment Among Youth under 25 years
Income
Poverty
Unemployment
Labor Participation
Family Structure
Vehicle Availability
Education Level
Disability

Unemployment Among Youth under 25 years Comparison

Estonians

Immigrants from Eritrea

Exceptional
Exceptional
11.3%
UNEMPLOYMENT AMONG YOUTH UNDER 25 YEARS
94.2/ 100
METRIC RATING
98th/ 347
METRIC RANK
11.1%
UNEMPLOYMENT AMONG YOUTH UNDER 25 YEARS
98.8/ 100
METRIC RATING
57th/ 347
METRIC RANK

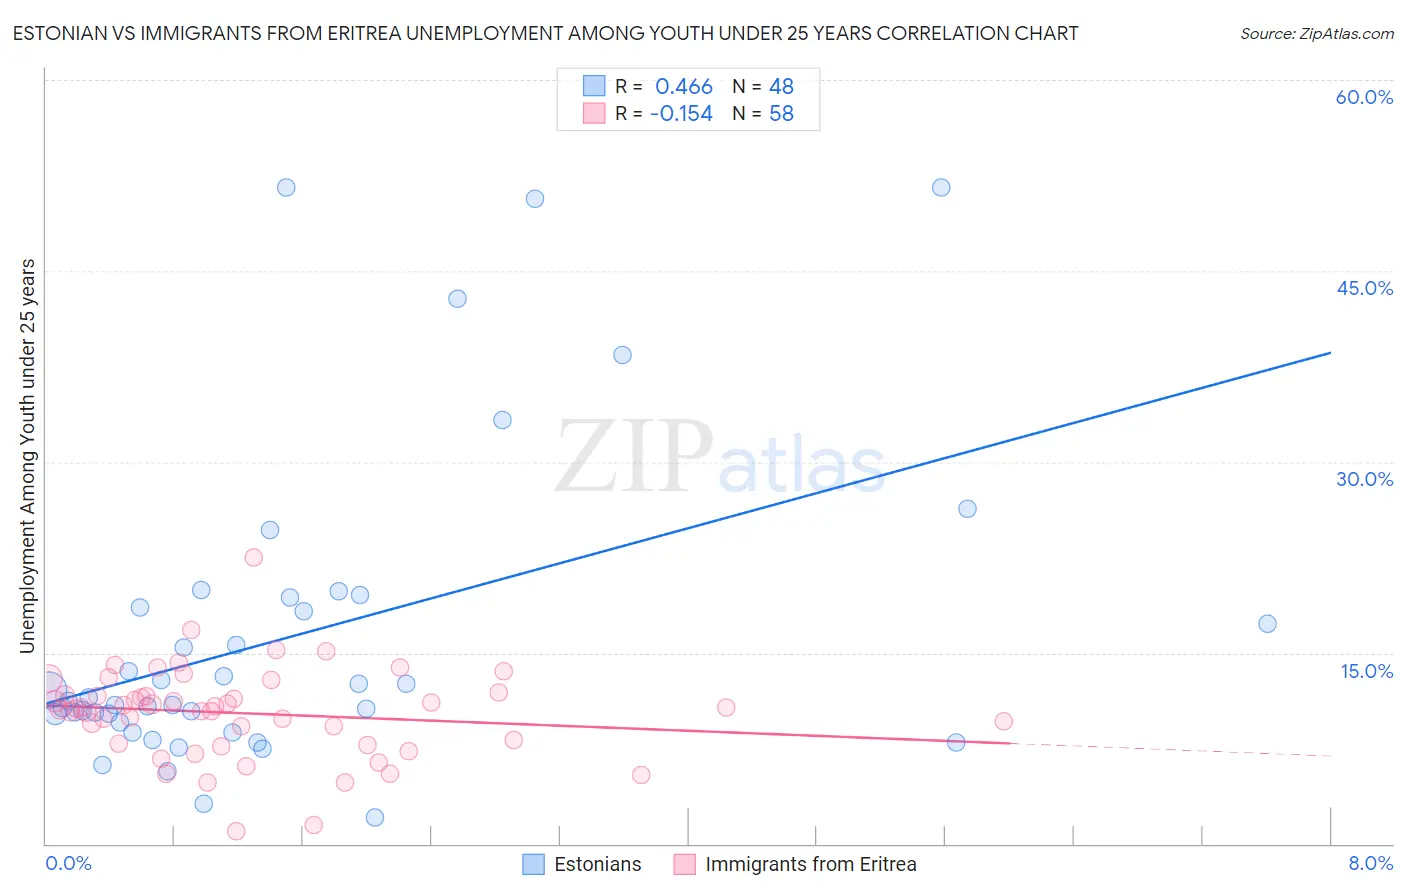
Estonian vs Immigrants from Eritrea Unemployment Among Youth under 25 years Correlation Chart

The statistical analysis conducted on geographies consisting of 122,888,730 people shows a moderate positive correlation between the proportion of Estonians and unemployment rate among youth under the age of 25 in the United States with a correlation coefficient (R) of 0.466 and weighted average of 11.3%. Similarly, the statistical analysis conducted on geographies consisting of 104,703,473 people shows a poor negative correlation between the proportion of Immigrants from Eritrea and unemployment rate among youth under the age of 25 in the United States with a correlation coefficient (R) of -0.154 and weighted average of 11.1%, a difference of 1.8%.
Estonian vs Immigrants from Eritrea Unemployment Among Youth under 25 years

Unemployment Among Youth under 25 years Correlation Summary

MeasurementEstonianImmigrants from Eritrea
Minimum2.1%1.0%
Maximum51.6%22.5%
Range49.5%21.5%
Mean16.3%10.2%
Median11.4%10.7%
Interquartile 25% (IQ1)9.8%7.9%
Interquartile 75% (IQ3)18.9%11.7%
Interquartile Range (IQR)9.1%3.8%
Standard Deviation (Sample)12.2%3.6%
Standard Deviation (Population)12.1%3.6%

Similar Demographics by Unemployment Among Youth under 25 years

Demographics Similar to Estonians by Unemployment Among Youth under 25 years

In terms of unemployment among youth under 25 years, the demographic groups most similar to Estonians are Nicaraguan (11.3%, a difference of 0.0%), Immigrants from Serbia (11.3%, a difference of 0.020%), Carpatho Rusyn (11.3%, a difference of 0.040%), Celtic (11.3%, a difference of 0.050%), and Pakistani (11.3%, a difference of 0.050%).
DemographicsRating | RankUnemployment Among Youth under 25 years
Immigrants | Taiwan
95.1
/100
|
#91
Exceptional
11.2%
Immigrants | Latvia
95.1
/100
|
#92
Exceptional
11.2%
Immigrants | North America
95.1
/100
|
#93
Exceptional
11.2%
Lithuanians
94.8
/100
|
#94
Exceptional
11.3%
Carpatho Rusyns
94.4
/100
|
#95
Exceptional
11.3%
Immigrants | Serbia
94.4
/100
|
#96
Exceptional
11.3%
Nicaraguans
94.3
/100
|
#97
Exceptional
11.3%
Estonians
94.2
/100
|
#98
Exceptional
11.3%
Celtics
94.0
/100
|
#99
Exceptional
11.3%
Pakistanis
94.0
/100
|
#100
Exceptional
11.3%
Iroquois
93.8
/100
|
#101
Exceptional
11.3%
Immigrants | Thailand
93.6
/100
|
#102
Exceptional
11.3%
Immigrants | Malaysia
93.6
/100
|
#103
Exceptional
11.3%
Immigrants | Afghanistan
93.4
/100
|
#104
Exceptional
11.3%
Immigrants | Jordan
93.1
/100
|
#105
Exceptional
11.3%

Demographics Similar to Immigrants from Eritrea by Unemployment Among Youth under 25 years

In terms of unemployment among youth under 25 years, the demographic groups most similar to Immigrants from Eritrea are Immigrants from Saudi Arabia (11.1%, a difference of 0.010%), Mongolian (11.1%, a difference of 0.030%), Irish (11.1%, a difference of 0.030%), Scotch-Irish (11.1%, a difference of 0.040%), and Immigrants from Eastern Africa (11.1%, a difference of 0.10%).
DemographicsRating | RankUnemployment Among Youth under 25 years
Czechoslovakians
99.2
/100
|
#50
Exceptional
11.0%
Serbians
99.0
/100
|
#51
Exceptional
11.0%
Latvians
99.0
/100
|
#52
Exceptional
11.0%
Ottawa
99.0
/100
|
#53
Exceptional
11.1%
Mongolians
98.9
/100
|
#54
Exceptional
11.1%
Irish
98.9
/100
|
#55
Exceptional
11.1%
Immigrants | Saudi Arabia
98.8
/100
|
#56
Exceptional
11.1%
Immigrants | Eritrea
98.8
/100
|
#57
Exceptional
11.1%
Scotch-Irish
98.8
/100
|
#58
Exceptional
11.1%
Immigrants | Eastern Africa
98.7
/100
|
#59
Exceptional
11.1%
South Africans
98.5
/100
|
#60
Exceptional
11.1%
Filipinos
98.3
/100
|
#61
Exceptional
11.1%
Immigrants | Netherlands
98.1
/100
|
#62
Exceptional
11.1%
Immigrants | Croatia
98.1
/100
|
#63
Exceptional
11.1%
Jordanians
97.9
/100
|
#64
Exceptional
11.1%