Egyptian vs South African Unemployment Among Seniors over 75 years
COMPARE
Egyptian
South African
Unemployment Among Seniors over 75 years
Unemployment Among Seniors over 75 years Comparison
Egyptians
South Africans
8.1%
UNEMPLOYMENT AMONG SENIORS OVER 75 YEARS
99.5/ 100
METRIC RATING
91st/ 347
METRIC RANK
7.5%
UNEMPLOYMENT AMONG SENIORS OVER 75 YEARS
100.0/ 100
METRIC RATING
26th/ 347
METRIC RANK
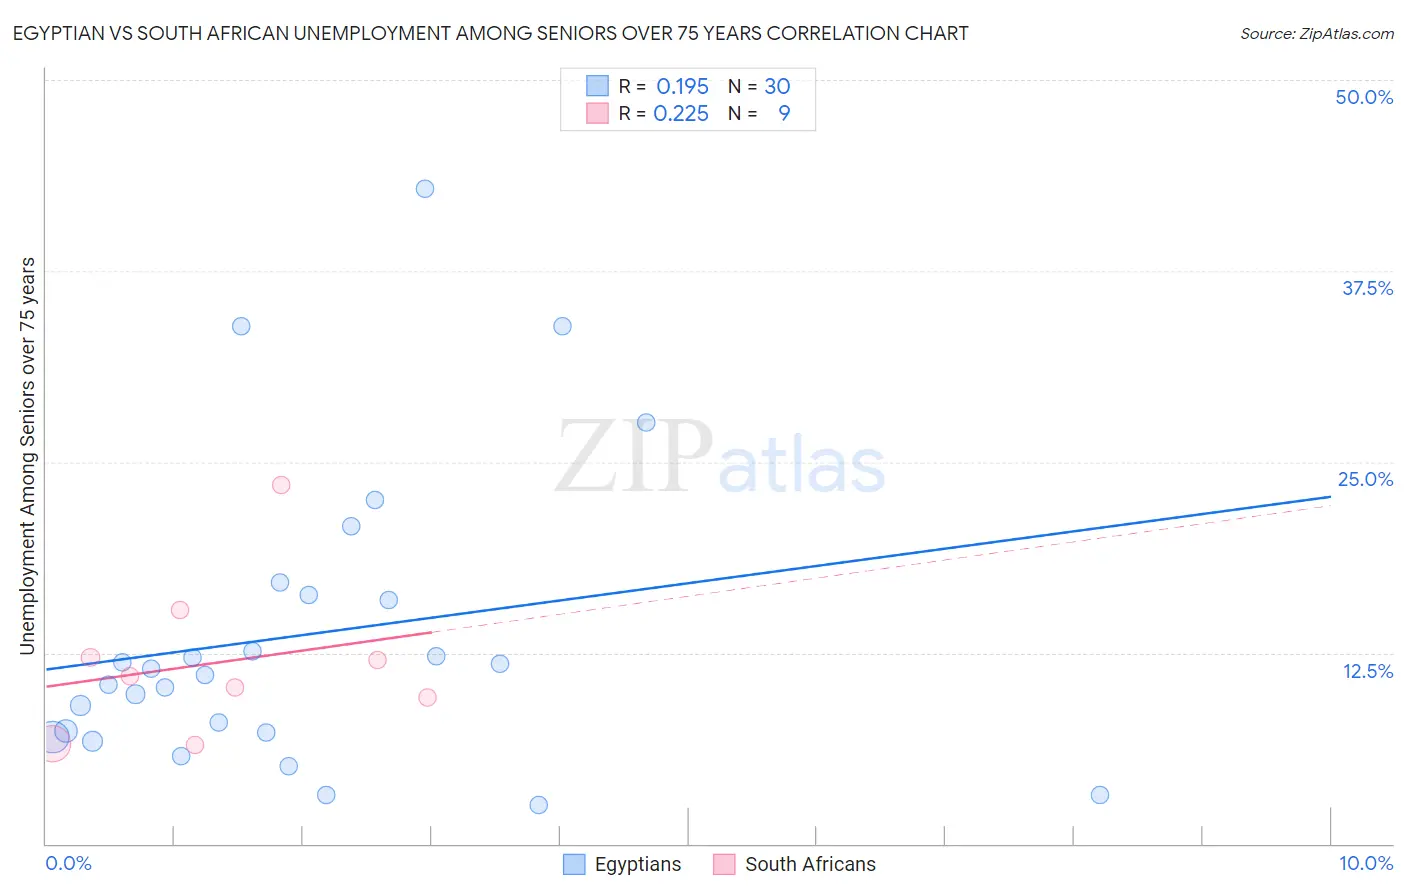
Egyptian vs South African Unemployment Among Seniors over 75 years Correlation Chart
The statistical analysis conducted on geographies consisting of 164,384,297 people shows a poor positive correlation between the proportion of Egyptians and unemployment rate among seniors over the age of 75 in the United States with a correlation coefficient (R) of 0.195 and weighted average of 8.1%. Similarly, the statistical analysis conducted on geographies consisting of 121,244,008 people shows a weak positive correlation between the proportion of South Africans and unemployment rate among seniors over the age of 75 in the United States with a correlation coefficient (R) of 0.225 and weighted average of 7.5%, a difference of 8.0%.
Unemployment Among Seniors over 75 years Correlation Summary
| Measurement | Egyptian | South African |
| Minimum | 2.5% | 6.4% |
| Maximum | 42.9% | 23.5% |
| Range | 40.4% | 17.1% |
| Mean | 13.7% | 11.9% |
| Median | 11.2% | 11.0% |
| Interquartile 25% (IQ1) | 7.3% | 8.1% |
| Interquartile 75% (IQ3) | 16.3% | 13.7% |
| Interquartile Range (IQR) | 9.0% | 5.7% |
| Standard Deviation (Sample) | 9.8% | 5.2% |
| Standard Deviation (Population) | 9.6% | 4.9% |
Similar Demographics by Unemployment Among Seniors over 75 years
Demographics Similar to Egyptians by Unemployment Among Seniors over 75 years
In terms of unemployment among seniors over 75 years, the demographic groups most similar to Egyptians are Venezuelan (8.1%, a difference of 0.0%), Immigrants from Vietnam (8.1%, a difference of 0.040%), Immigrants from Netherlands (8.1%, a difference of 0.090%), Immigrants from Korea (8.1%, a difference of 0.12%), and Immigrants from Ireland (8.1%, a difference of 0.12%).
| Demographics | Rating | Rank | Unemployment Among Seniors over 75 years |
| U.S. Virgin Islanders | 99.7 /100 | #84 | Exceptional 8.1% |
| Immigrants | Indonesia | 99.7 /100 | #85 | Exceptional 8.1% |
| Immigrants | Singapore | 99.7 /100 | #86 | Exceptional 8.1% |
| Basques | 99.5 /100 | #87 | Exceptional 8.1% |
| New Zealanders | 99.5 /100 | #88 | Exceptional 8.1% |
| Immigrants | Korea | 99.5 /100 | #89 | Exceptional 8.1% |
| Immigrants | Vietnam | 99.5 /100 | #90 | Exceptional 8.1% |
| Egyptians | 99.5 /100 | #91 | Exceptional 8.1% |
| Venezuelans | 99.5 /100 | #92 | Exceptional 8.1% |
| Immigrants | Netherlands | 99.5 /100 | #93 | Exceptional 8.1% |
| Immigrants | Ireland | 99.4 /100 | #94 | Exceptional 8.1% |
| Nicaraguans | 99.3 /100 | #95 | Exceptional 8.2% |
| Immigrants | Belgium | 99.3 /100 | #96 | Exceptional 8.2% |
| Immigrants | Sri Lanka | 99.3 /100 | #97 | Exceptional 8.2% |
| Immigrants | Northern Africa | 99.3 /100 | #98 | Exceptional 8.2% |
Demographics Similar to South Africans by Unemployment Among Seniors over 75 years
In terms of unemployment among seniors over 75 years, the demographic groups most similar to South Africans are Immigrants from Uruguay (7.5%, a difference of 0.18%), Immigrants from Barbados (7.6%, a difference of 0.44%), Immigrants from Israel (7.6%, a difference of 0.55%), Immigrants from Iran (7.6%, a difference of 0.59%), and Immigrants from Sweden (7.6%, a difference of 0.70%).
| Demographics | Rating | Rank | Unemployment Among Seniors over 75 years |
| Immigrants | Zaire | 100.0 /100 | #19 | Exceptional 7.2% |
| Armenians | 100.0 /100 | #20 | Exceptional 7.2% |
| Chickasaw | 100.0 /100 | #21 | Exceptional 7.3% |
| Cypriots | 100.0 /100 | #22 | Exceptional 7.4% |
| Israelis | 100.0 /100 | #23 | Exceptional 7.4% |
| Immigrants | Cuba | 100.0 /100 | #24 | Exceptional 7.4% |
| Immigrants | Uruguay | 100.0 /100 | #25 | Exceptional 7.5% |
| South Africans | 100.0 /100 | #26 | Exceptional 7.5% |
| Immigrants | Barbados | 100.0 /100 | #27 | Exceptional 7.6% |
| Immigrants | Israel | 100.0 /100 | #28 | Exceptional 7.6% |
| Immigrants | Iran | 100.0 /100 | #29 | Exceptional 7.6% |
| Immigrants | Sweden | 100.0 /100 | #30 | Exceptional 7.6% |
| Guyanese | 100.0 /100 | #31 | Exceptional 7.6% |
| Immigrants | Hong Kong | 100.0 /100 | #32 | Exceptional 7.6% |
| Cambodians | 100.0 /100 | #33 | Exceptional 7.6% |