Ecuadorian vs Czech Male Poverty
COMPARE
Ecuadorian
Czech
Male Poverty
Male Poverty Comparison
Ecuadorians
Czechs
12.7%
MALE POVERTY
0.4/ 100
METRIC RATING
238th/ 347
METRIC RANK
9.8%
MALE POVERTY
99.4/ 100
METRIC RATING
36th/ 347
METRIC RANK
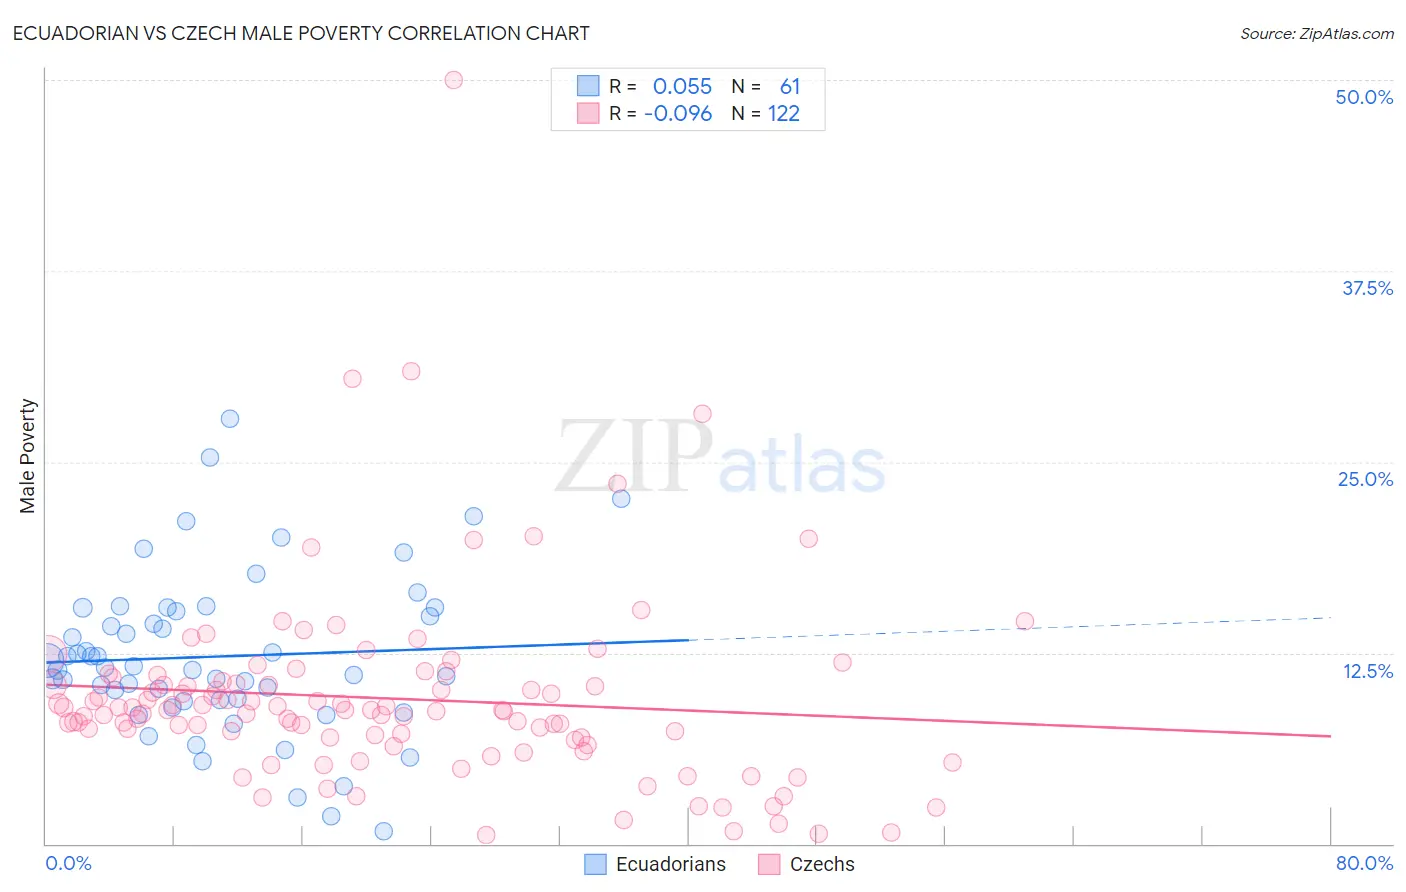
Ecuadorian vs Czech Male Poverty Correlation Chart
The statistical analysis conducted on geographies consisting of 317,549,368 people shows a slight positive correlation between the proportion of Ecuadorians and poverty level among males in the United States with a correlation coefficient (R) of 0.055 and weighted average of 12.7%. Similarly, the statistical analysis conducted on geographies consisting of 484,041,978 people shows a slight negative correlation between the proportion of Czechs and poverty level among males in the United States with a correlation coefficient (R) of -0.096 and weighted average of 9.8%, a difference of 29.4%.
Male Poverty Correlation Summary
| Measurement | Ecuadorian | Czech |
| Minimum | 0.81% | 0.55% |
| Maximum | 27.8% | 50.0% |
| Range | 27.0% | 49.5% |
| Mean | 12.3% | 9.5% |
| Median | 11.6% | 8.7% |
| Interquartile 25% (IQ1) | 9.4% | 7.0% |
| Interquartile 75% (IQ3) | 15.3% | 10.4% |
| Interquartile Range (IQR) | 6.0% | 3.5% |
| Standard Deviation (Sample) | 5.3% | 6.4% |
| Standard Deviation (Population) | 5.3% | 6.4% |
Similar Demographics by Male Poverty
Demographics Similar to Ecuadorians by Male Poverty
In terms of male poverty, the demographic groups most similar to Ecuadorians are Ghanaian (12.7%, a difference of 0.0%), French American Indian (12.7%, a difference of 0.030%), Immigrants from Saudi Arabia (12.7%, a difference of 0.080%), Immigrants from Middle Africa (12.7%, a difference of 0.28%), and Immigrants from Laos (12.6%, a difference of 0.32%).
| Demographics | Rating | Rank | Male Poverty |
| Salvadorans | 0.6 /100 | #231 | Tragic 12.6% |
| Nicaraguans | 0.6 /100 | #232 | Tragic 12.6% |
| Fijians | 0.6 /100 | #233 | Tragic 12.6% |
| Immigrants | Armenia | 0.6 /100 | #234 | Tragic 12.6% |
| Immigrants | Laos | 0.5 /100 | #235 | Tragic 12.6% |
| Immigrants | Saudi Arabia | 0.4 /100 | #236 | Tragic 12.7% |
| French American Indians | 0.4 /100 | #237 | Tragic 12.7% |
| Ecuadorians | 0.4 /100 | #238 | Tragic 12.7% |
| Ghanaians | 0.4 /100 | #239 | Tragic 12.7% |
| Immigrants | Middle Africa | 0.4 /100 | #240 | Tragic 12.7% |
| Sudanese | 0.3 /100 | #241 | Tragic 12.8% |
| Nepalese | 0.3 /100 | #242 | Tragic 12.8% |
| Alaskan Athabascans | 0.3 /100 | #243 | Tragic 12.8% |
| Tsimshian | 0.3 /100 | #244 | Tragic 12.8% |
| Liberians | 0.3 /100 | #245 | Tragic 12.8% |
Demographics Similar to Czechs by Male Poverty
In terms of male poverty, the demographic groups most similar to Czechs are Iranian (9.8%, a difference of 0.090%), Immigrants from Greece (9.8%, a difference of 0.22%), Immigrants from Poland (9.8%, a difference of 0.39%), Immigrants from Northern Europe (9.7%, a difference of 0.54%), and Immigrants from Pakistan (9.9%, a difference of 0.59%).
| Demographics | Rating | Rank | Male Poverty |
| Greeks | 99.6 /100 | #29 | Exceptional 9.7% |
| Poles | 99.5 /100 | #30 | Exceptional 9.7% |
| Tongans | 99.5 /100 | #31 | Exceptional 9.7% |
| Macedonians | 99.5 /100 | #32 | Exceptional 9.7% |
| Immigrants | Northern Europe | 99.5 /100 | #33 | Exceptional 9.7% |
| Immigrants | Poland | 99.5 /100 | #34 | Exceptional 9.8% |
| Iranians | 99.4 /100 | #35 | Exceptional 9.8% |
| Czechs | 99.4 /100 | #36 | Exceptional 9.8% |
| Immigrants | Greece | 99.3 /100 | #37 | Exceptional 9.8% |
| Immigrants | Pakistan | 99.2 /100 | #38 | Exceptional 9.9% |
| Russians | 99.2 /100 | #39 | Exceptional 9.9% |
| Cypriots | 99.2 /100 | #40 | Exceptional 9.9% |
| Koreans | 99.2 /100 | #41 | Exceptional 9.9% |
| Immigrants | Iran | 99.1 /100 | #42 | Exceptional 9.9% |
| Immigrants | Moldova | 99.0 /100 | #43 | Exceptional 9.9% |