Ecuadorian vs Argentinean Poverty
COMPARE
Ecuadorian
Argentinean
Poverty
Poverty Comparison
Ecuadorians
Argentineans
14.0%
POVERTY
0.4/ 100
METRIC RATING
242nd/ 347
METRIC RANK
11.7%
POVERTY
89.1/ 100
METRIC RATING
118th/ 347
METRIC RANK
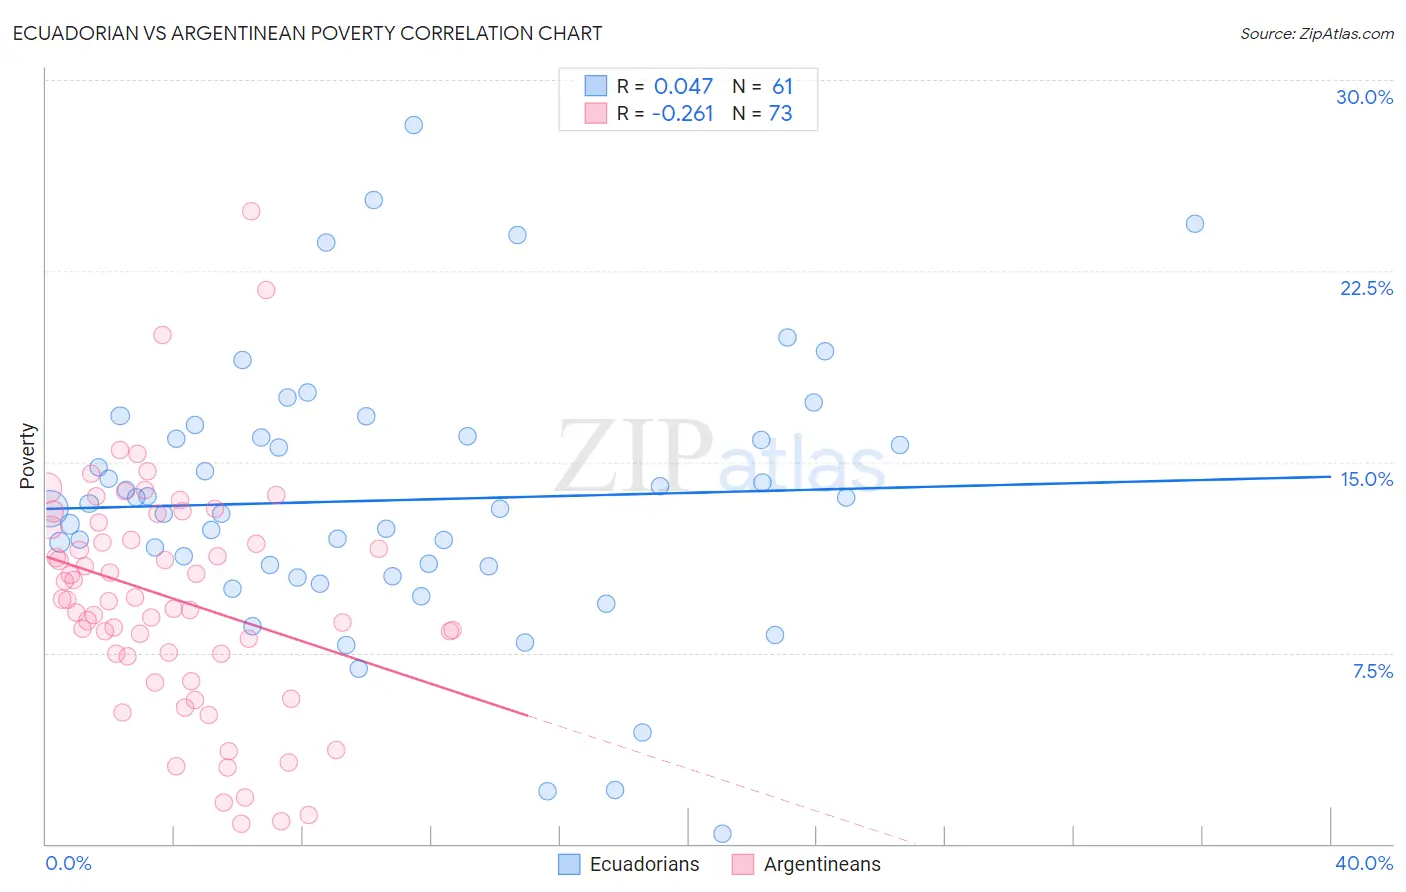
Ecuadorian vs Argentinean Poverty Correlation Chart
The statistical analysis conducted on geographies consisting of 317,659,954 people shows no correlation between the proportion of Ecuadorians and poverty level in the United States with a correlation coefficient (R) of 0.047 and weighted average of 14.0%. Similarly, the statistical analysis conducted on geographies consisting of 296,986,445 people shows a weak negative correlation between the proportion of Argentineans and poverty level in the United States with a correlation coefficient (R) of -0.261 and weighted average of 11.7%, a difference of 19.8%.
Poverty Correlation Summary
| Measurement | Ecuadorian | Argentinean |
| Minimum | 0.41% | 0.81% |
| Maximum | 28.2% | 24.8% |
| Range | 27.8% | 24.0% |
| Mean | 13.5% | 9.7% |
| Median | 13.2% | 9.6% |
| Interquartile 25% (IQ1) | 10.7% | 7.4% |
| Interquartile 75% (IQ3) | 16.0% | 12.5% |
| Interquartile Range (IQR) | 5.3% | 5.1% |
| Standard Deviation (Sample) | 5.3% | 4.6% |
| Standard Deviation (Population) | 5.3% | 4.5% |
Similar Demographics by Poverty
Demographics Similar to Ecuadorians by Poverty
In terms of poverty, the demographic groups most similar to Ecuadorians are Sudanese (14.0%, a difference of 0.070%), Nepalese (14.0%, a difference of 0.10%), Salvadoran (14.0%, a difference of 0.31%), Immigrants from Middle Africa (14.0%, a difference of 0.34%), and Nicaraguan (13.9%, a difference of 0.46%).
| Demographics | Rating | Rank | Poverty |
| Cubans | 0.6 /100 | #235 | Tragic 13.9% |
| Immigrants | Armenia | 0.5 /100 | #236 | Tragic 13.9% |
| French American Indians | 0.5 /100 | #237 | Tragic 13.9% |
| Ghanaians | 0.5 /100 | #238 | Tragic 13.9% |
| Nicaraguans | 0.4 /100 | #239 | Tragic 13.9% |
| Immigrants | Middle Africa | 0.4 /100 | #240 | Tragic 14.0% |
| Salvadorans | 0.4 /100 | #241 | Tragic 14.0% |
| Ecuadorians | 0.4 /100 | #242 | Tragic 14.0% |
| Sudanese | 0.3 /100 | #243 | Tragic 14.0% |
| Nepalese | 0.3 /100 | #244 | Tragic 14.0% |
| Immigrants | Sudan | 0.3 /100 | #245 | Tragic 14.1% |
| Potawatomi | 0.3 /100 | #246 | Tragic 14.1% |
| Liberians | 0.2 /100 | #247 | Tragic 14.1% |
| Immigrants | Western Africa | 0.2 /100 | #248 | Tragic 14.1% |
| Immigrants | Ghana | 0.2 /100 | #249 | Tragic 14.2% |
Demographics Similar to Argentineans by Poverty
In terms of poverty, the demographic groups most similar to Argentineans are Tlingit-Haida (11.7%, a difference of 0.040%), Immigrants from South Eastern Asia (11.7%, a difference of 0.050%), Sri Lankan (11.7%, a difference of 0.080%), New Zealander (11.7%, a difference of 0.11%), and Puget Sound Salish (11.7%, a difference of 0.11%).
| Demographics | Rating | Rank | Poverty |
| French Canadians | 91.0 /100 | #111 | Exceptional 11.6% |
| Immigrants | Southern Europe | 90.8 /100 | #112 | Exceptional 11.6% |
| Immigrants | Belarus | 90.8 /100 | #113 | Exceptional 11.6% |
| Immigrants | China | 90.7 /100 | #114 | Exceptional 11.6% |
| Albanians | 90.3 /100 | #115 | Exceptional 11.7% |
| Immigrants | Russia | 89.7 /100 | #116 | Excellent 11.7% |
| Sri Lankans | 89.4 /100 | #117 | Excellent 11.7% |
| Argentineans | 89.1 /100 | #118 | Excellent 11.7% |
| Tlingit-Haida | 89.0 /100 | #119 | Excellent 11.7% |
| Immigrants | South Eastern Asia | 88.9 /100 | #120 | Excellent 11.7% |
| New Zealanders | 88.7 /100 | #121 | Excellent 11.7% |
| Puget Sound Salish | 88.7 /100 | #122 | Excellent 11.7% |
| Immigrants | Hungary | 88.6 /100 | #123 | Excellent 11.7% |
| Soviet Union | 88.4 /100 | #124 | Excellent 11.7% |
| Immigrants | Brazil | 88.2 /100 | #125 | Excellent 11.7% |