Dominican vs Immigrants from Cuba Single Mother Poverty
COMPARE
Dominican
Immigrants from Cuba
Single Mother Poverty
Single Mother Poverty Comparison
Dominicans
Immigrants from Cuba
34.5%
SINGLE MOTHER POVERTY
0.0/ 100
METRIC RATING
316th/ 347
METRIC RANK
30.1%
SINGLE MOTHER POVERTY
6.9/ 100
METRIC RATING
223rd/ 347
METRIC RANK
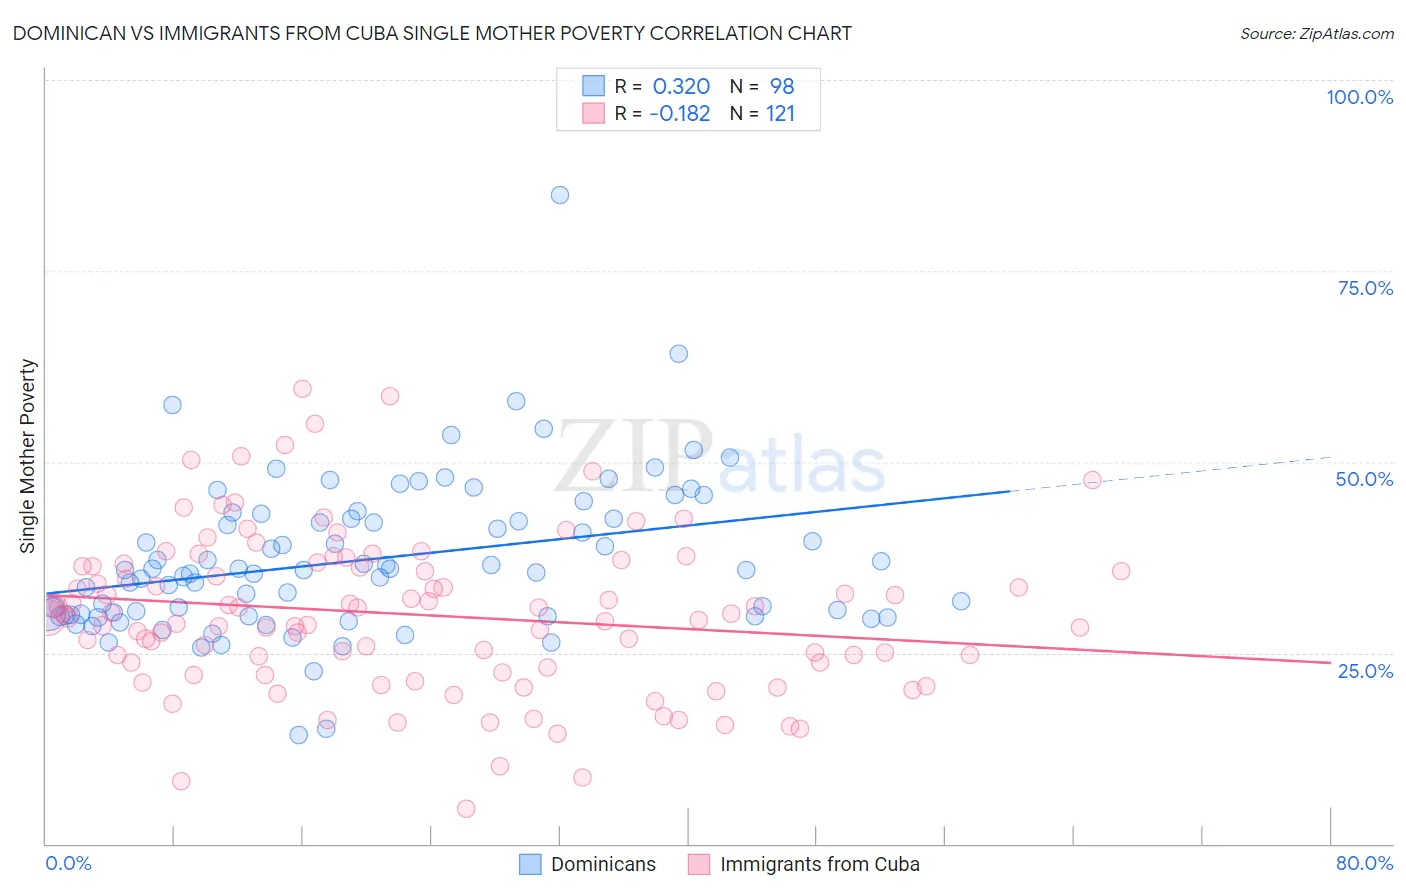
Dominican vs Immigrants from Cuba Single Mother Poverty Correlation Chart
The statistical analysis conducted on geographies consisting of 347,165,672 people shows a mild positive correlation between the proportion of Dominicans and poverty level among single mothers in the United States with a correlation coefficient (R) of 0.320 and weighted average of 34.5%. Similarly, the statistical analysis conducted on geographies consisting of 320,148,902 people shows a poor negative correlation between the proportion of Immigrants from Cuba and poverty level among single mothers in the United States with a correlation coefficient (R) of -0.182 and weighted average of 30.1%, a difference of 14.7%.
Single Mother Poverty Correlation Summary
| Measurement | Dominican | Immigrants from Cuba |
| Minimum | 14.2% | 4.7% |
| Maximum | 84.9% | 59.5% |
| Range | 70.7% | 54.9% |
| Mean | 37.2% | 30.0% |
| Median | 35.8% | 29.6% |
| Interquartile 25% (IQ1) | 30.0% | 23.4% |
| Interquartile 75% (IQ3) | 42.5% | 36.4% |
| Interquartile Range (IQR) | 12.6% | 13.0% |
| Standard Deviation (Sample) | 10.2% | 10.3% |
| Standard Deviation (Population) | 10.1% | 10.2% |
Similar Demographics by Single Mother Poverty
Demographics Similar to Dominicans by Single Mother Poverty
In terms of single mother poverty, the demographic groups most similar to Dominicans are Cherokee (34.5%, a difference of 0.11%), Hopi (34.5%, a difference of 0.12%), Chickasaw (34.4%, a difference of 0.20%), Immigrants from Dominican Republic (34.4%, a difference of 0.37%), and Central American Indian (34.3%, a difference of 0.45%).
| Demographics | Rating | Rank | Single Mother Poverty |
| Potawatomi | 0.0 /100 | #309 | Tragic 34.1% |
| Hondurans | 0.0 /100 | #310 | Tragic 34.2% |
| Alsatians | 0.0 /100 | #311 | Tragic 34.3% |
| Central American Indians | 0.0 /100 | #312 | Tragic 34.3% |
| Immigrants | Dominican Republic | 0.0 /100 | #313 | Tragic 34.4% |
| Chickasaw | 0.0 /100 | #314 | Tragic 34.4% |
| Hopi | 0.0 /100 | #315 | Tragic 34.5% |
| Dominicans | 0.0 /100 | #316 | Tragic 34.5% |
| Cherokee | 0.0 /100 | #317 | Tragic 34.5% |
| Immigrants | Honduras | 0.0 /100 | #318 | Tragic 34.7% |
| Chippewa | 0.0 /100 | #319 | Tragic 34.8% |
| Iroquois | 0.0 /100 | #320 | Tragic 34.8% |
| Paiute | 0.0 /100 | #321 | Tragic 35.1% |
| Blacks/African Americans | 0.0 /100 | #322 | Tragic 35.2% |
| Kiowa | 0.0 /100 | #323 | Tragic 35.5% |
Demographics Similar to Immigrants from Cuba by Single Mother Poverty
In terms of single mother poverty, the demographic groups most similar to Immigrants from Cuba are Immigrants from Sudan (30.1%, a difference of 0.070%), Spanish (30.1%, a difference of 0.10%), Sudanese (30.0%, a difference of 0.13%), Immigrants from Eritrea (30.0%, a difference of 0.14%), and Scottish (30.1%, a difference of 0.16%).
| Demographics | Rating | Rank | Single Mother Poverty |
| Immigrants | Western Africa | 11.5 /100 | #216 | Poor 29.9% |
| Immigrants | Ghana | 11.3 /100 | #217 | Poor 29.9% |
| Hungarians | 10.3 /100 | #218 | Poor 29.9% |
| Finns | 9.3 /100 | #219 | Tragic 30.0% |
| Germans | 8.8 /100 | #220 | Tragic 30.0% |
| Immigrants | Eritrea | 7.7 /100 | #221 | Tragic 30.0% |
| Sudanese | 7.6 /100 | #222 | Tragic 30.0% |
| Immigrants | Cuba | 6.9 /100 | #223 | Tragic 30.1% |
| Immigrants | Sudan | 6.5 /100 | #224 | Tragic 30.1% |
| Spanish | 6.3 /100 | #225 | Tragic 30.1% |
| Scottish | 6.0 /100 | #226 | Tragic 30.1% |
| Immigrants | Liberia | 5.9 /100 | #227 | Tragic 30.1% |
| Spaniards | 5.4 /100 | #228 | Tragic 30.2% |
| Immigrants | Barbados | 5.0 /100 | #229 | Tragic 30.2% |
| English | 4.8 /100 | #230 | Tragic 30.2% |