Dominican vs Greek Single Mother Poverty
COMPARE
Dominican
Greek
Single Mother Poverty
Single Mother Poverty Comparison
Dominicans
Greeks
34.5%
SINGLE MOTHER POVERTY
0.0/ 100
METRIC RATING
316th/ 347
METRIC RANK
27.7%
SINGLE MOTHER POVERTY
98.7/ 100
METRIC RATING
83rd/ 347
METRIC RANK
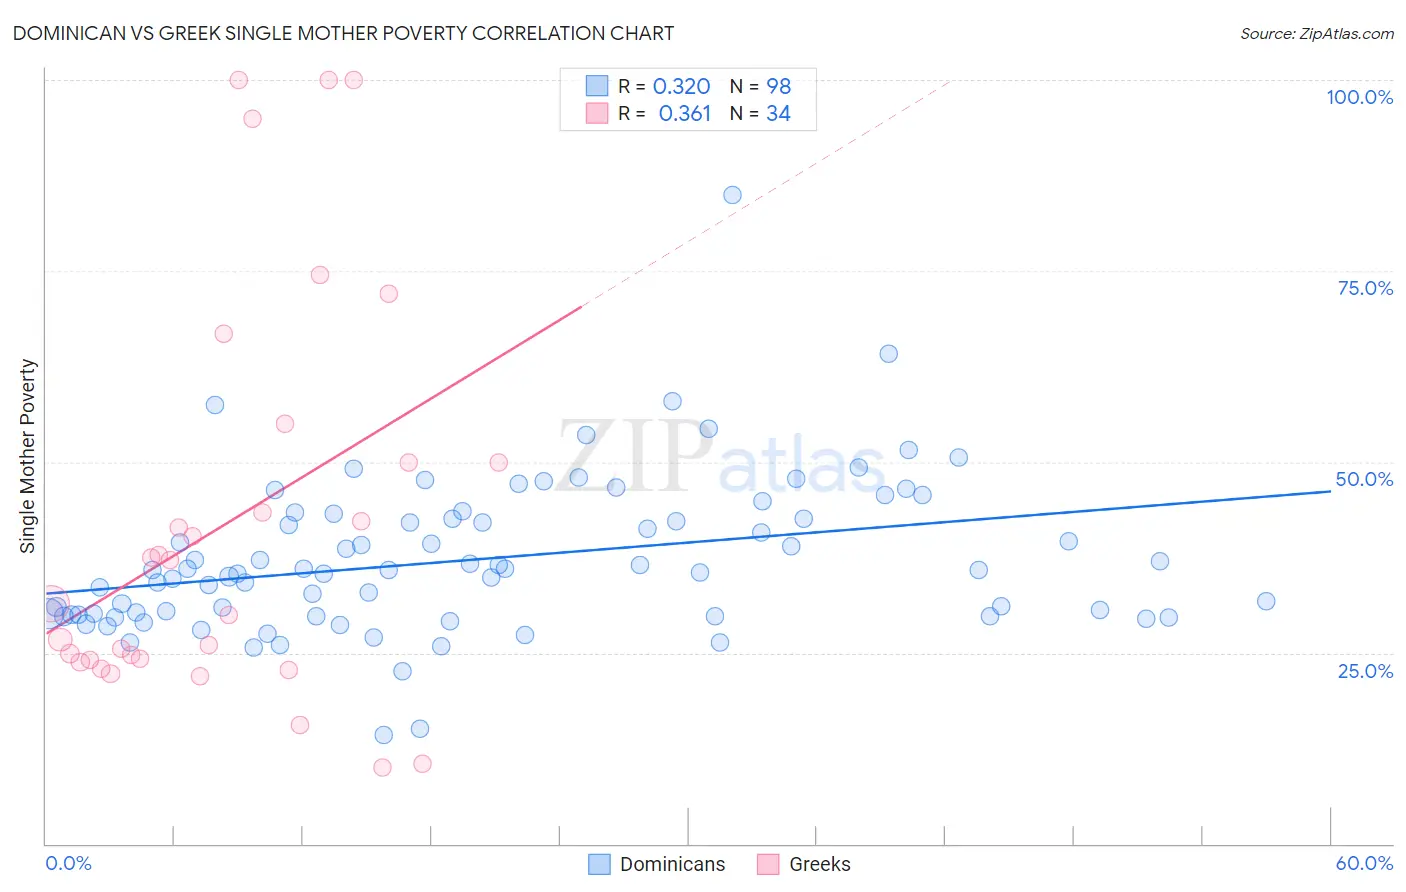
Dominican vs Greek Single Mother Poverty Correlation Chart
The statistical analysis conducted on geographies consisting of 347,165,672 people shows a mild positive correlation between the proportion of Dominicans and poverty level among single mothers in the United States with a correlation coefficient (R) of 0.320 and weighted average of 34.5%. Similarly, the statistical analysis conducted on geographies consisting of 465,143,502 people shows a mild positive correlation between the proportion of Greeks and poverty level among single mothers in the United States with a correlation coefficient (R) of 0.361 and weighted average of 27.7%, a difference of 24.7%.
Single Mother Poverty Correlation Summary
| Measurement | Dominican | Greek |
| Minimum | 14.2% | 10.0% |
| Maximum | 84.9% | 100.0% |
| Range | 70.7% | 90.0% |
| Mean | 37.2% | 42.1% |
| Median | 35.8% | 34.3% |
| Interquartile 25% (IQ1) | 30.0% | 24.1% |
| Interquartile 75% (IQ3) | 42.5% | 50.0% |
| Interquartile Range (IQR) | 12.6% | 25.9% |
| Standard Deviation (Sample) | 10.2% | 26.2% |
| Standard Deviation (Population) | 10.1% | 25.8% |
Similar Demographics by Single Mother Poverty
Demographics Similar to Dominicans by Single Mother Poverty
In terms of single mother poverty, the demographic groups most similar to Dominicans are Cherokee (34.5%, a difference of 0.11%), Hopi (34.5%, a difference of 0.12%), Chickasaw (34.4%, a difference of 0.20%), Immigrants from Dominican Republic (34.4%, a difference of 0.37%), and Central American Indian (34.3%, a difference of 0.45%).
| Demographics | Rating | Rank | Single Mother Poverty |
| Potawatomi | 0.0 /100 | #309 | Tragic 34.1% |
| Hondurans | 0.0 /100 | #310 | Tragic 34.2% |
| Alsatians | 0.0 /100 | #311 | Tragic 34.3% |
| Central American Indians | 0.0 /100 | #312 | Tragic 34.3% |
| Immigrants | Dominican Republic | 0.0 /100 | #313 | Tragic 34.4% |
| Chickasaw | 0.0 /100 | #314 | Tragic 34.4% |
| Hopi | 0.0 /100 | #315 | Tragic 34.5% |
| Dominicans | 0.0 /100 | #316 | Tragic 34.5% |
| Cherokee | 0.0 /100 | #317 | Tragic 34.5% |
| Immigrants | Honduras | 0.0 /100 | #318 | Tragic 34.7% |
| Chippewa | 0.0 /100 | #319 | Tragic 34.8% |
| Iroquois | 0.0 /100 | #320 | Tragic 34.8% |
| Paiute | 0.0 /100 | #321 | Tragic 35.1% |
| Blacks/African Americans | 0.0 /100 | #322 | Tragic 35.2% |
| Kiowa | 0.0 /100 | #323 | Tragic 35.5% |
Demographics Similar to Greeks by Single Mother Poverty
In terms of single mother poverty, the demographic groups most similar to Greeks are Immigrants from Latvia (27.7%, a difference of 0.030%), Mongolian (27.7%, a difference of 0.040%), Immigrants from Cameroon (27.6%, a difference of 0.050%), Immigrants from Ukraine (27.7%, a difference of 0.13%), and Immigrants from Scotland (27.6%, a difference of 0.18%).
| Demographics | Rating | Rank | Single Mother Poverty |
| Peruvians | 99.2 /100 | #76 | Exceptional 27.5% |
| Immigrants | Peru | 99.2 /100 | #77 | Exceptional 27.5% |
| Immigrants | North Macedonia | 99.2 /100 | #78 | Exceptional 27.5% |
| Immigrants | Italy | 99.1 /100 | #79 | Exceptional 27.5% |
| Taiwanese | 99.1 /100 | #80 | Exceptional 27.5% |
| Immigrants | Scotland | 98.9 /100 | #81 | Exceptional 27.6% |
| Immigrants | Cameroon | 98.8 /100 | #82 | Exceptional 27.6% |
| Greeks | 98.7 /100 | #83 | Exceptional 27.7% |
| Immigrants | Latvia | 98.7 /100 | #84 | Exceptional 27.7% |
| Mongolians | 98.7 /100 | #85 | Exceptional 27.7% |
| Immigrants | Ukraine | 98.6 /100 | #86 | Exceptional 27.7% |
| Afghans | 98.5 /100 | #87 | Exceptional 27.7% |
| Ethiopians | 98.4 /100 | #88 | Exceptional 27.7% |
| Immigrants | Ethiopia | 98.4 /100 | #89 | Exceptional 27.7% |
| Immigrants | France | 98.2 /100 | #90 | Exceptional 27.8% |