Arab vs Immigrants from Turkey Single Mother Poverty
COMPARE
Arab
Immigrants from Turkey
Single Mother Poverty
Single Mother Poverty Comparison
Arabs
Immigrants from Turkey
29.0%
SINGLE MOTHER POVERTY
60.7/ 100
METRIC RATING
165th/ 347
METRIC RANK
27.3%
SINGLE MOTHER POVERTY
99.5/ 100
METRIC RATING
65th/ 347
METRIC RANK
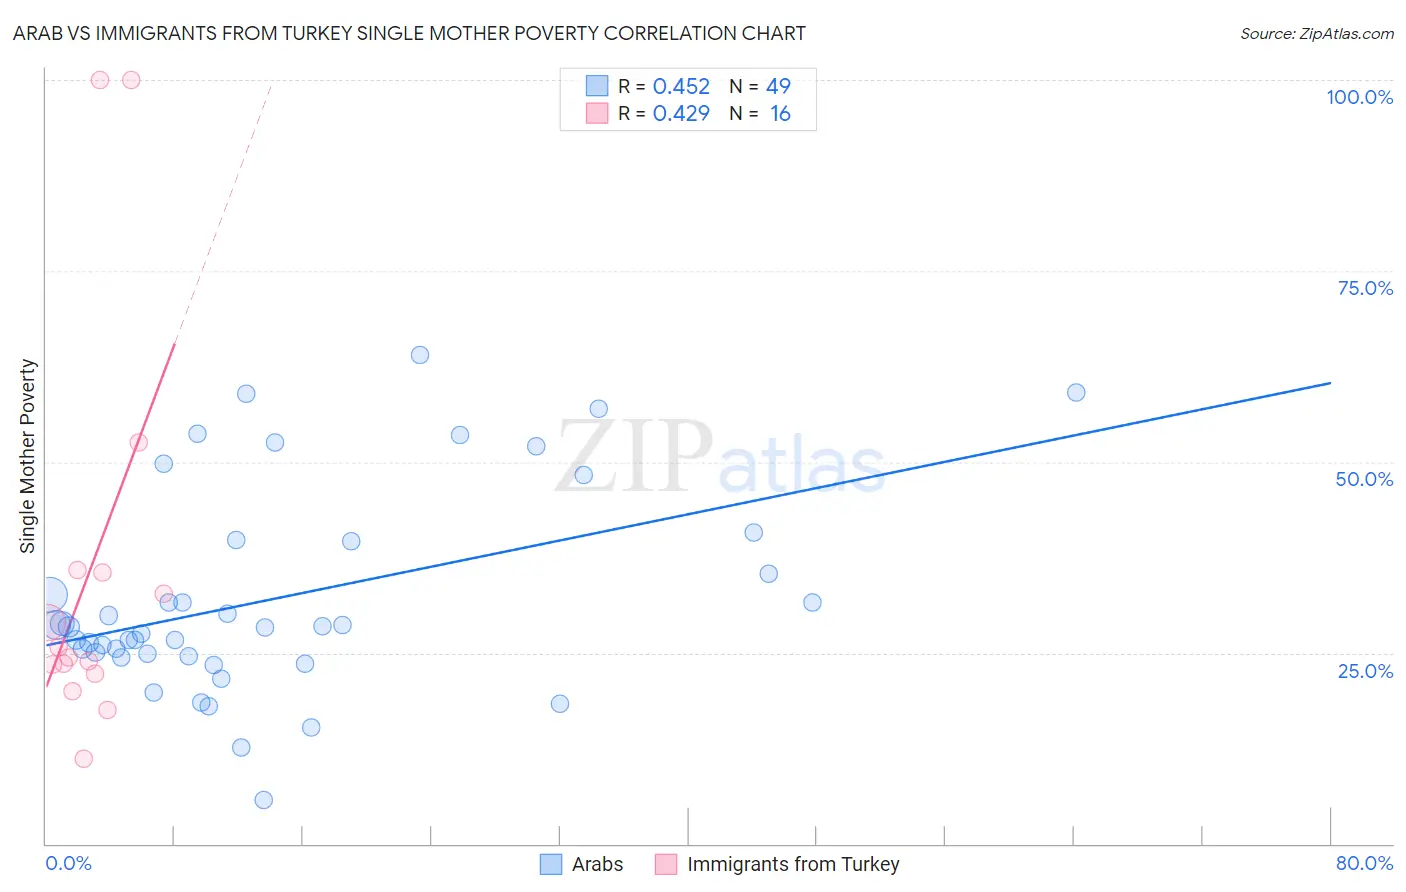
Arab vs Immigrants from Turkey Single Mother Poverty Correlation Chart
The statistical analysis conducted on geographies consisting of 470,668,307 people shows a moderate positive correlation between the proportion of Arabs and poverty level among single mothers in the United States with a correlation coefficient (R) of 0.452 and weighted average of 29.0%. Similarly, the statistical analysis conducted on geographies consisting of 218,733,554 people shows a moderate positive correlation between the proportion of Immigrants from Turkey and poverty level among single mothers in the United States with a correlation coefficient (R) of 0.429 and weighted average of 27.3%, a difference of 6.2%.
Single Mother Poverty Correlation Summary
| Measurement | Arab | Immigrants from Turkey |
| Minimum | 5.8% | 11.1% |
| Maximum | 63.9% | 100.0% |
| Range | 58.1% | 88.9% |
| Mean | 32.2% | 36.1% |
| Median | 28.4% | 25.0% |
| Interquartile 25% (IQ1) | 24.8% | 22.8% |
| Interquartile 75% (IQ3) | 39.7% | 35.6% |
| Interquartile Range (IQR) | 14.9% | 12.8% |
| Standard Deviation (Sample) | 13.3% | 26.6% |
| Standard Deviation (Population) | 13.2% | 25.8% |
Similar Demographics by Single Mother Poverty
Demographics Similar to Arabs by Single Mother Poverty
In terms of single mother poverty, the demographic groups most similar to Arabs are Inupiat (29.0%, a difference of 0.020%), Costa Rican (29.0%, a difference of 0.12%), European (29.1%, a difference of 0.16%), Immigrants from Uruguay (29.1%, a difference of 0.17%), and Immigrants from Nigeria (28.9%, a difference of 0.27%).
| Demographics | Rating | Rank | Single Mother Poverty |
| Immigrants | Hungary | 70.6 /100 | #158 | Good 28.9% |
| Czechs | 68.4 /100 | #159 | Good 28.9% |
| Japanese | 68.0 /100 | #160 | Good 28.9% |
| Immigrants | Cambodia | 66.6 /100 | #161 | Good 28.9% |
| Scandinavians | 66.2 /100 | #162 | Good 28.9% |
| Immigrants | Nigeria | 65.9 /100 | #163 | Good 28.9% |
| Immigrants | Kenya | 65.9 /100 | #164 | Good 28.9% |
| Arabs | 60.7 /100 | #165 | Good 29.0% |
| Inupiat | 60.4 /100 | #166 | Good 29.0% |
| Costa Ricans | 58.4 /100 | #167 | Average 29.0% |
| Europeans | 57.6 /100 | #168 | Average 29.1% |
| Immigrants | Uruguay | 57.2 /100 | #169 | Average 29.1% |
| New Zealanders | 55.1 /100 | #170 | Average 29.1% |
| Puget Sound Salish | 55.1 /100 | #171 | Average 29.1% |
| Carpatho Rusyns | 53.8 /100 | #172 | Average 29.1% |
Demographics Similar to Immigrants from Turkey by Single Mother Poverty
In terms of single mother poverty, the demographic groups most similar to Immigrants from Turkey are Soviet Union (27.3%, a difference of 0.040%), Immigrants from Australia (27.3%, a difference of 0.060%), Russian (27.3%, a difference of 0.080%), Immigrants from Czechoslovakia (27.4%, a difference of 0.090%), and Immigrants from Northern Europe (27.3%, a difference of 0.11%).
| Demographics | Rating | Rank | Single Mother Poverty |
| Argentineans | 99.6 /100 | #58 | Exceptional 27.2% |
| Paraguayans | 99.6 /100 | #59 | Exceptional 27.2% |
| Eastern Europeans | 99.6 /100 | #60 | Exceptional 27.2% |
| Immigrants | Eastern Europe | 99.6 /100 | #61 | Exceptional 27.2% |
| Immigrants | Malaysia | 99.5 /100 | #62 | Exceptional 27.3% |
| Immigrants | Northern Europe | 99.5 /100 | #63 | Exceptional 27.3% |
| Russians | 99.5 /100 | #64 | Exceptional 27.3% |
| Immigrants | Turkey | 99.5 /100 | #65 | Exceptional 27.3% |
| Soviet Union | 99.5 /100 | #66 | Exceptional 27.3% |
| Immigrants | Australia | 99.5 /100 | #67 | Exceptional 27.3% |
| Immigrants | Czechoslovakia | 99.5 /100 | #68 | Exceptional 27.4% |
| Lithuanians | 99.4 /100 | #69 | Exceptional 27.4% |
| Immigrants | Belarus | 99.4 /100 | #70 | Exceptional 27.4% |
| Macedonians | 99.4 /100 | #71 | Exceptional 27.4% |
| Immigrants | Russia | 99.4 /100 | #72 | Exceptional 27.4% |