Yaqui vs Immigrants from Turkey Single Mother Poverty
COMPARE
Yaqui
Immigrants from Turkey
Single Mother Poverty
Single Mother Poverty Comparison
Yaqui
Immigrants from Turkey
33.1%
SINGLE MOTHER POVERTY
0.0/ 100
METRIC RATING
295th/ 347
METRIC RANK
27.3%
SINGLE MOTHER POVERTY
99.5/ 100
METRIC RATING
65th/ 347
METRIC RANK
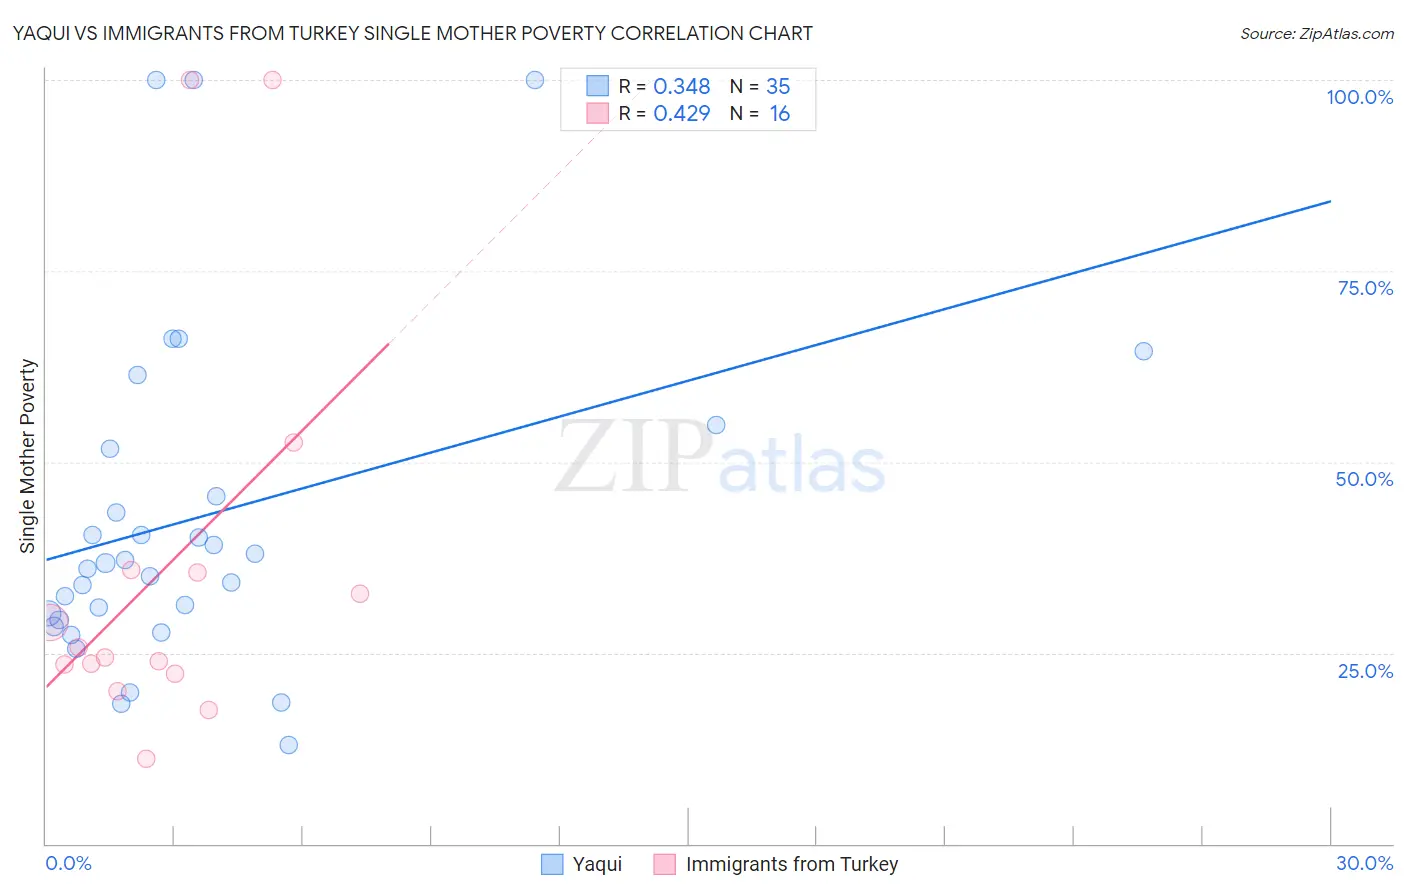
Yaqui vs Immigrants from Turkey Single Mother Poverty Correlation Chart
The statistical analysis conducted on geographies consisting of 106,870,477 people shows a mild positive correlation between the proportion of Yaqui and poverty level among single mothers in the United States with a correlation coefficient (R) of 0.348 and weighted average of 33.1%. Similarly, the statistical analysis conducted on geographies consisting of 218,733,554 people shows a moderate positive correlation between the proportion of Immigrants from Turkey and poverty level among single mothers in the United States with a correlation coefficient (R) of 0.429 and weighted average of 27.3%, a difference of 21.3%.
Single Mother Poverty Correlation Summary
| Measurement | Yaqui | Immigrants from Turkey |
| Minimum | 12.9% | 11.1% |
| Maximum | 100.0% | 100.0% |
| Range | 87.1% | 88.9% |
| Mean | 42.8% | 36.1% |
| Median | 36.7% | 25.0% |
| Interquartile 25% (IQ1) | 29.3% | 22.8% |
| Interquartile 75% (IQ3) | 51.8% | 35.6% |
| Interquartile Range (IQR) | 22.5% | 12.8% |
| Standard Deviation (Sample) | 22.1% | 26.6% |
| Standard Deviation (Population) | 21.8% | 25.8% |
Similar Demographics by Single Mother Poverty
Demographics Similar to Yaqui by Single Mother Poverty
In terms of single mother poverty, the demographic groups most similar to Yaqui are French American Indian (33.1%, a difference of 0.030%), Blackfeet (33.2%, a difference of 0.16%), Pennsylvania German (33.2%, a difference of 0.30%), African (33.3%, a difference of 0.41%), and Immigrants from Guatemala (33.3%, a difference of 0.50%).
| Demographics | Rating | Rank | Single Mother Poverty |
| Somalis | 0.0 /100 | #288 | Tragic 32.6% |
| U.S. Virgin Islanders | 0.0 /100 | #289 | Tragic 32.6% |
| Osage | 0.0 /100 | #290 | Tragic 32.6% |
| Guatemalans | 0.0 /100 | #291 | Tragic 32.9% |
| Shoshone | 0.0 /100 | #292 | Tragic 32.9% |
| Aleuts | 0.0 /100 | #293 | Tragic 32.9% |
| French American Indians | 0.0 /100 | #294 | Tragic 33.1% |
| Yaqui | 0.0 /100 | #295 | Tragic 33.1% |
| Blackfeet | 0.0 /100 | #296 | Tragic 33.2% |
| Pennsylvania Germans | 0.0 /100 | #297 | Tragic 33.2% |
| Africans | 0.0 /100 | #298 | Tragic 33.3% |
| Immigrants | Guatemala | 0.0 /100 | #299 | Tragic 33.3% |
| Hispanics or Latinos | 0.0 /100 | #300 | Tragic 33.3% |
| Immigrants | Somalia | 0.0 /100 | #301 | Tragic 33.4% |
| Arapaho | 0.0 /100 | #302 | Tragic 33.4% |
Demographics Similar to Immigrants from Turkey by Single Mother Poverty
In terms of single mother poverty, the demographic groups most similar to Immigrants from Turkey are Soviet Union (27.3%, a difference of 0.040%), Immigrants from Australia (27.3%, a difference of 0.060%), Russian (27.3%, a difference of 0.080%), Immigrants from Czechoslovakia (27.4%, a difference of 0.090%), and Immigrants from Northern Europe (27.3%, a difference of 0.11%).
| Demographics | Rating | Rank | Single Mother Poverty |
| Argentineans | 99.6 /100 | #58 | Exceptional 27.2% |
| Paraguayans | 99.6 /100 | #59 | Exceptional 27.2% |
| Eastern Europeans | 99.6 /100 | #60 | Exceptional 27.2% |
| Immigrants | Eastern Europe | 99.6 /100 | #61 | Exceptional 27.2% |
| Immigrants | Malaysia | 99.5 /100 | #62 | Exceptional 27.3% |
| Immigrants | Northern Europe | 99.5 /100 | #63 | Exceptional 27.3% |
| Russians | 99.5 /100 | #64 | Exceptional 27.3% |
| Immigrants | Turkey | 99.5 /100 | #65 | Exceptional 27.3% |
| Soviet Union | 99.5 /100 | #66 | Exceptional 27.3% |
| Immigrants | Australia | 99.5 /100 | #67 | Exceptional 27.3% |
| Immigrants | Czechoslovakia | 99.5 /100 | #68 | Exceptional 27.4% |
| Lithuanians | 99.4 /100 | #69 | Exceptional 27.4% |
| Immigrants | Belarus | 99.4 /100 | #70 | Exceptional 27.4% |
| Macedonians | 99.4 /100 | #71 | Exceptional 27.4% |
| Immigrants | Russia | 99.4 /100 | #72 | Exceptional 27.4% |