Dominican vs Immigrants from Burma/Myanmar Female Poverty Among 25-34 Year Olds
COMPARE
Dominican
Immigrants from Burma/Myanmar
Female Poverty Among 25-34 Year Olds
Female Poverty Among 25-34 Year Olds Comparison
Dominicans
Immigrants from Burma/Myanmar
17.6%
FEMALE POVERTY AMONG 25-34 YEAR OLDS
0.0/ 100
METRIC RATING
316th/ 347
METRIC RANK
15.2%
FEMALE POVERTY AMONG 25-34 YEAR OLDS
0.3/ 100
METRIC RATING
257th/ 347
METRIC RANK
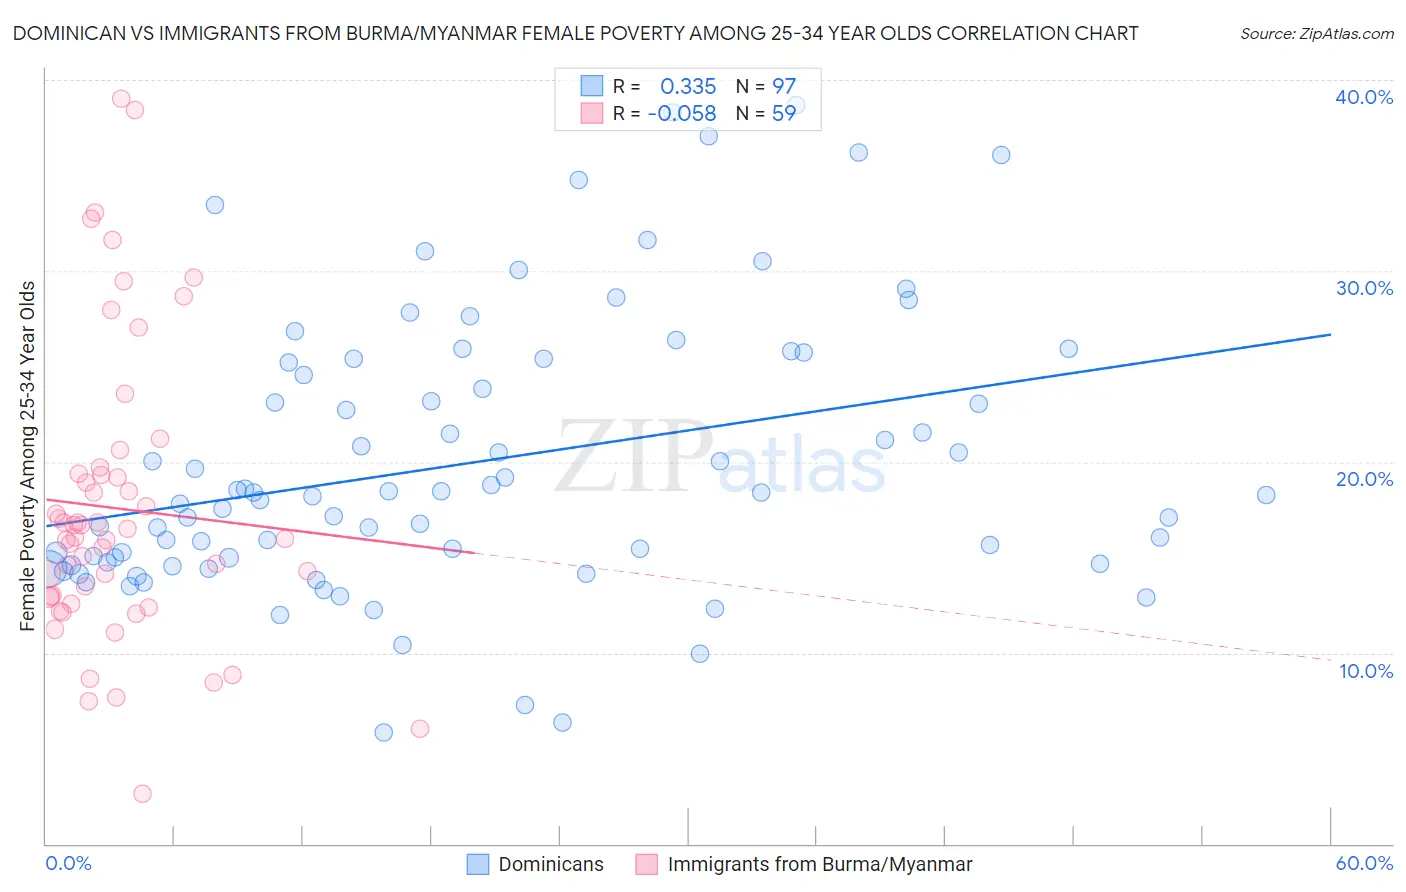
Dominican vs Immigrants from Burma/Myanmar Female Poverty Among 25-34 Year Olds Correlation Chart
The statistical analysis conducted on geographies consisting of 350,065,024 people shows a mild positive correlation between the proportion of Dominicans and poverty level among females between the ages 25 and 34 in the United States with a correlation coefficient (R) of 0.335 and weighted average of 17.6%. Similarly, the statistical analysis conducted on geographies consisting of 171,442,894 people shows a slight negative correlation between the proportion of Immigrants from Burma/Myanmar and poverty level among females between the ages 25 and 34 in the United States with a correlation coefficient (R) of -0.058 and weighted average of 15.2%, a difference of 16.1%.
Female Poverty Among 25-34 Year Olds Correlation Summary
| Measurement | Dominican | Immigrants from Burma/Myanmar |
| Minimum | 5.8% | 2.6% |
| Maximum | 38.7% | 39.0% |
| Range | 32.9% | 36.4% |
| Mean | 19.9% | 17.6% |
| Median | 18.3% | 16.0% |
| Interquartile 25% (IQ1) | 14.7% | 12.9% |
| Interquartile 75% (IQ3) | 25.3% | 19.4% |
| Interquartile Range (IQR) | 10.6% | 6.5% |
| Standard Deviation (Sample) | 7.2% | 7.7% |
| Standard Deviation (Population) | 7.2% | 7.6% |
Similar Demographics by Female Poverty Among 25-34 Year Olds
Demographics Similar to Dominicans by Female Poverty Among 25-34 Year Olds
In terms of female poverty among 25-34 year olds, the demographic groups most similar to Dominicans are Yakama (17.6%, a difference of 0.0%), Immigrants from Dominican Republic (17.6%, a difference of 0.22%), Arapaho (17.8%, a difference of 0.79%), Colville (17.5%, a difference of 0.90%), and Iroquois (17.5%, a difference of 0.98%).
| Demographics | Rating | Rank | Female Poverty Among 25-34 Year Olds |
| Ottawa | 0.0 /100 | #309 | Tragic 17.1% |
| Cherokee | 0.0 /100 | #310 | Tragic 17.2% |
| Immigrants | Honduras | 0.0 /100 | #311 | Tragic 17.3% |
| Iroquois | 0.0 /100 | #312 | Tragic 17.5% |
| Colville | 0.0 /100 | #313 | Tragic 17.5% |
| Immigrants | Dominican Republic | 0.0 /100 | #314 | Tragic 17.6% |
| Yakama | 0.0 /100 | #315 | Tragic 17.6% |
| Dominicans | 0.0 /100 | #316 | Tragic 17.6% |
| Arapaho | 0.0 /100 | #317 | Tragic 17.8% |
| Ute | 0.0 /100 | #318 | Tragic 17.9% |
| Menominee | 0.0 /100 | #319 | Tragic 18.0% |
| Chippewa | 0.0 /100 | #320 | Tragic 18.0% |
| Choctaw | 0.0 /100 | #321 | Tragic 18.1% |
| Central American Indians | 0.0 /100 | #322 | Tragic 18.2% |
| Seminole | 0.0 /100 | #323 | Tragic 18.3% |
Demographics Similar to Immigrants from Burma/Myanmar by Female Poverty Among 25-34 Year Olds
In terms of female poverty among 25-34 year olds, the demographic groups most similar to Immigrants from Burma/Myanmar are West Indian (15.2%, a difference of 0.020%), Immigrants from Laos (15.2%, a difference of 0.19%), Nepalese (15.2%, a difference of 0.25%), Immigrants from Cuba (15.2%, a difference of 0.28%), and Somali (15.1%, a difference of 0.58%).
| Demographics | Rating | Rank | Female Poverty Among 25-34 Year Olds |
| Immigrants | El Salvador | 0.5 /100 | #250 | Tragic 15.0% |
| Haitians | 0.5 /100 | #251 | Tragic 15.0% |
| Belizeans | 0.4 /100 | #252 | Tragic 15.1% |
| Immigrants | West Indies | 0.4 /100 | #253 | Tragic 15.1% |
| Somalis | 0.4 /100 | #254 | Tragic 15.1% |
| Immigrants | Laos | 0.3 /100 | #255 | Tragic 15.2% |
| West Indians | 0.3 /100 | #256 | Tragic 15.2% |
| Immigrants | Burma/Myanmar | 0.3 /100 | #257 | Tragic 15.2% |
| Nepalese | 0.2 /100 | #258 | Tragic 15.2% |
| Immigrants | Cuba | 0.2 /100 | #259 | Tragic 15.2% |
| Marshallese | 0.2 /100 | #260 | Tragic 15.3% |
| Liberians | 0.2 /100 | #261 | Tragic 15.3% |
| Immigrants | Belize | 0.2 /100 | #262 | Tragic 15.3% |
| Mexican American Indians | 0.2 /100 | #263 | Tragic 15.4% |
| Pennsylvania Germans | 0.1 /100 | #264 | Tragic 15.4% |