Dominican vs Immigrants from Burma/Myanmar In Labor Force | Age 20-64

COMPARE

Dominican
Race
Ancestry
AfghanAfricanAlaska NativeAlaskan AthabascanAlbanianAleutAlsatianAmericanApacheArabArapahoArgentineanArmenianAssyrian/Chaldean/SyriacAustralianAustrianBahamianBangladeshiBarbadianBasqueBelgianBelizeanBermudanBhutaneseBlackfeetBolivianBrazilianBritishBritish West IndianBulgarianBurmeseCajunCambodianCanadianCape VerdeanCarpatho RusynCelticCentral AmericanCentral American IndianCherokeeCheyenneChickasawChileanChineseChippewaChoctawColombianColvilleComancheCosta RicanCreeCreekCroatianCrowCubanCypriotCzechCzechoslovakianDanishDelawareDominicanDutchDutch West IndianEastern EuropeanEcuadorianEgyptianEnglishEstonianEthiopianEuropeanFijianFilipinoFinnishFrenchFrench American IndianFrench CanadianGermanGerman RussianGhanaianGreekGuamanian/ChamorroGuatemalanGuyaneseHaitianHmongHonduranHopiHoumaHungarianIcelanderIndian (Asian)IndonesianInupiatIranianIraqiIrishIroquoisIsraeliItalianJamaicanJapaneseJordanianKenyanKiowaKoreanLaotianLatvianLebaneseLiberianLithuanianLumbeeLuxembourgerMacedonianMalaysianMalteseMarshalleseMenomineeMexicanMexican American IndianMongolianMoroccanNative HawaiianNavajoNepaleseNew ZealanderNicaraguanNigerianNorthern EuropeanNorwegianOkinawanOsageOttawaPaiutePakistaniPalestinianPanamanianParaguayanPennsylvania GermanPeruvianPimaPolishPortuguesePotawatomiPuebloPuerto RicanPuget Sound SalishRomanianRussianSalvadoranSamoanScandinavianScotch-IrishScottishSeminoleSenegaleseSerbianShoshoneSierra LeoneanSiouxSlavicSlovakSloveneSomaliSouth AfricanSouth AmericanSouth American IndianSoviet UnionSpaniardSpanishSpanish AmericanSpanish American IndianSri LankanSubsaharan AfricanSudaneseSwedishSwissSyrianTaiwaneseThaiTlingit-HaidaTohono O'OdhamTonganTrinidadian and TobagonianTsimshianTurkishU.S. Virgin IslanderUgandanUkrainianUruguayanUteVenezuelanVietnameseWelshWest IndianYakamaYaquiYugoslavianYumanYup'ikZimbabwean
Immigration
NonimmigrantsImmigrantsAfghanistanAfricaAlbaniaArgentinaArmeniaAsiaAustraliaAustriaBahamasBangladeshBarbadosBelarusBelgiumBelizeBoliviaBosnia and HerzegovinaBrazilBulgariaCabo VerdeCambodiaCameroonCanadaCaribbeanCentral AmericaChileChinaColombiaCongoCosta RicaCroatiaCubaCzechoslovakiaDenmarkDominicaDominican RepublicEastern AfricaEastern AsiaEastern EuropeEcuadorEgyptEl SalvadorEnglandEritreaEthiopiaEuropeFijiFranceGermanyGhanaGreeceGrenadaGuatemalaGuyanaHaitiHondurasHong KongHungaryIndiaIndonesiaIranIraqIrelandIsraelItalyJamaicaJapanJordanKazakhstanKenyaKoreaKuwaitLaosLatin AmericaLatviaLebanonLiberiaLithuaniaMalaysiaMexicoMicronesiaMiddle AfricaMoldovaMoroccoNepalNetherlandsNicaraguaNigeriaNorth AmericaNorth MacedoniaNorthern AfricaNorthern EuropeNorwayOceaniaPakistanPanamaPeruPhilippinesPolandPortugalRomaniaRussiaSaudi ArabiaScotlandSenegalSerbiaSierra LeoneSingaporeSomaliaSouth AfricaSouth AmericaSouth Central AsiaSouth Eastern AsiaSouthern EuropeSpainSri LankaSt. Vincent and the GrenadinesSudanSwedenSwitzerlandSyriaTaiwanThailandTrinidad and TobagoTurkeyUgandaUkraineUruguayUzbekistanVenezuelaVietnamWest IndiesWestern AfricaWestern AsiaWestern EuropeYemenZaireZimbabweAzores
Immigrants from Burma/Myanmar
Race
Ancestry
AfghanAfricanAlaska NativeAlaskan AthabascanAlbanianAleutAlsatianAmericanApacheArabArapahoArgentineanArmenianAssyrian/Chaldean/SyriacAustralianAustrianBahamianBangladeshiBarbadianBasqueBelgianBelizeanBermudanBhutaneseBlackfeetBolivianBrazilianBritishBritish West IndianBulgarianBurmeseCajunCambodianCanadianCape VerdeanCarpatho RusynCelticCentral AmericanCentral American IndianCherokeeCheyenneChickasawChileanChineseChippewaChoctawColombianColvilleComancheCosta RicanCreeCreekCroatianCrowCubanCypriotCzechCzechoslovakianDanishDelawareDutchDutch West IndianEastern EuropeanEcuadorianEgyptianEnglishEstonianEthiopianEuropeanFijianFilipinoFinnishFrenchFrench American IndianFrench CanadianGermanGerman RussianGhanaianGreekGuamanian/ChamorroGuatemalanGuyaneseHaitianHmongHonduranHopiHoumaHungarianIcelanderIndian (Asian)IndonesianInupiatIranianIraqiIrishIroquoisIsraeliItalianJamaicanJapaneseJordanianKenyanKiowaKoreanLaotianLatvianLebaneseLiberianLithuanianLumbeeLuxembourgerMacedonianMalaysianMalteseMarshalleseMenomineeMexicanMexican American IndianMongolianMoroccanNative HawaiianNavajoNepaleseNew ZealanderNicaraguanNigerianNorthern EuropeanNorwegianOkinawanOsageOttawaPaiutePakistaniPalestinianPanamanianParaguayanPennsylvania GermanPeruvianPimaPolishPortuguesePotawatomiPuebloPuerto RicanPuget Sound SalishRomanianRussianSalvadoranSamoanScandinavianScotch-IrishScottishSeminoleSenegaleseSerbianShoshoneSierra LeoneanSiouxSlavicSlovakSloveneSomaliSouth AfricanSouth AmericanSouth American IndianSoviet UnionSpaniardSpanishSpanish AmericanSpanish American IndianSri LankanSubsaharan AfricanSudaneseSwedishSwissSyrianTaiwaneseThaiTlingit-HaidaTohono O'OdhamTonganTrinidadian and TobagonianTsimshianTurkishU.S. Virgin IslanderUgandanUkrainianUruguayanUteVenezuelanVietnameseWelshWest IndianYakamaYaquiYugoslavianYumanYup'ikZimbabwean
Immigration
NonimmigrantsImmigrantsAfghanistanAfricaAlbaniaArgentinaArmeniaAsiaAustraliaAustriaBahamasBangladeshBarbadosBelarusBelgiumBelizeBoliviaBosnia and HerzegovinaBrazilBulgariaBurma/MyanmarCabo VerdeCambodiaCameroonCanadaCaribbeanCentral AmericaChileChinaColombiaCongoCosta RicaCroatiaCubaCzechoslovakiaDenmarkDominicaDominican RepublicEastern AfricaEastern AsiaEastern EuropeEcuadorEgyptEl SalvadorEnglandEritreaEthiopiaEuropeFijiFranceGermanyGhanaGreeceGrenadaGuatemalaGuyanaHaitiHondurasHong KongHungaryIndiaIndonesiaIranIraqIrelandIsraelItalyJamaicaJapanJordanKazakhstanKenyaKoreaKuwaitLaosLatin AmericaLatviaLebanonLiberiaLithuaniaMalaysiaMexicoMicronesiaMiddle AfricaMoldovaMoroccoNepalNetherlandsNicaraguaNigeriaNorth AmericaNorth MacedoniaNorthern AfricaNorthern EuropeNorwayOceaniaPakistanPanamaPeruPhilippinesPolandPortugalRomaniaRussiaSaudi ArabiaScotlandSenegalSerbiaSierra LeoneSingaporeSomaliaSouth AfricaSouth AmericaSouth Central AsiaSouth Eastern AsiaSouthern EuropeSpainSri LankaSt. Vincent and the GrenadinesSudanSwedenSwitzerlandSyriaTaiwanThailandTrinidad and TobagoTurkeyUgandaUkraineUruguayUzbekistanVenezuelaVietnamWest IndiesWestern AfricaWestern AsiaWestern EuropeYemenZaireZimbabweAzores
In Labor Force | Age 20-64
Income
Poverty
Unemployment
Labor Participation
Family Structure
Vehicle Availability
Education Level
Disability

In Labor Force | Age 20-64 Comparison

Dominicans

Immigrants from Burma/Myanmar

Tragic
Good
77.7%
IN LABOR FORCE | AGE 20-64
0.0/ 100
METRIC RATING
297th/ 347
METRIC RANK
79.7%
IN LABOR FORCE | AGE 20-64
64.4/ 100
METRIC RATING
164th/ 347
METRIC RANK

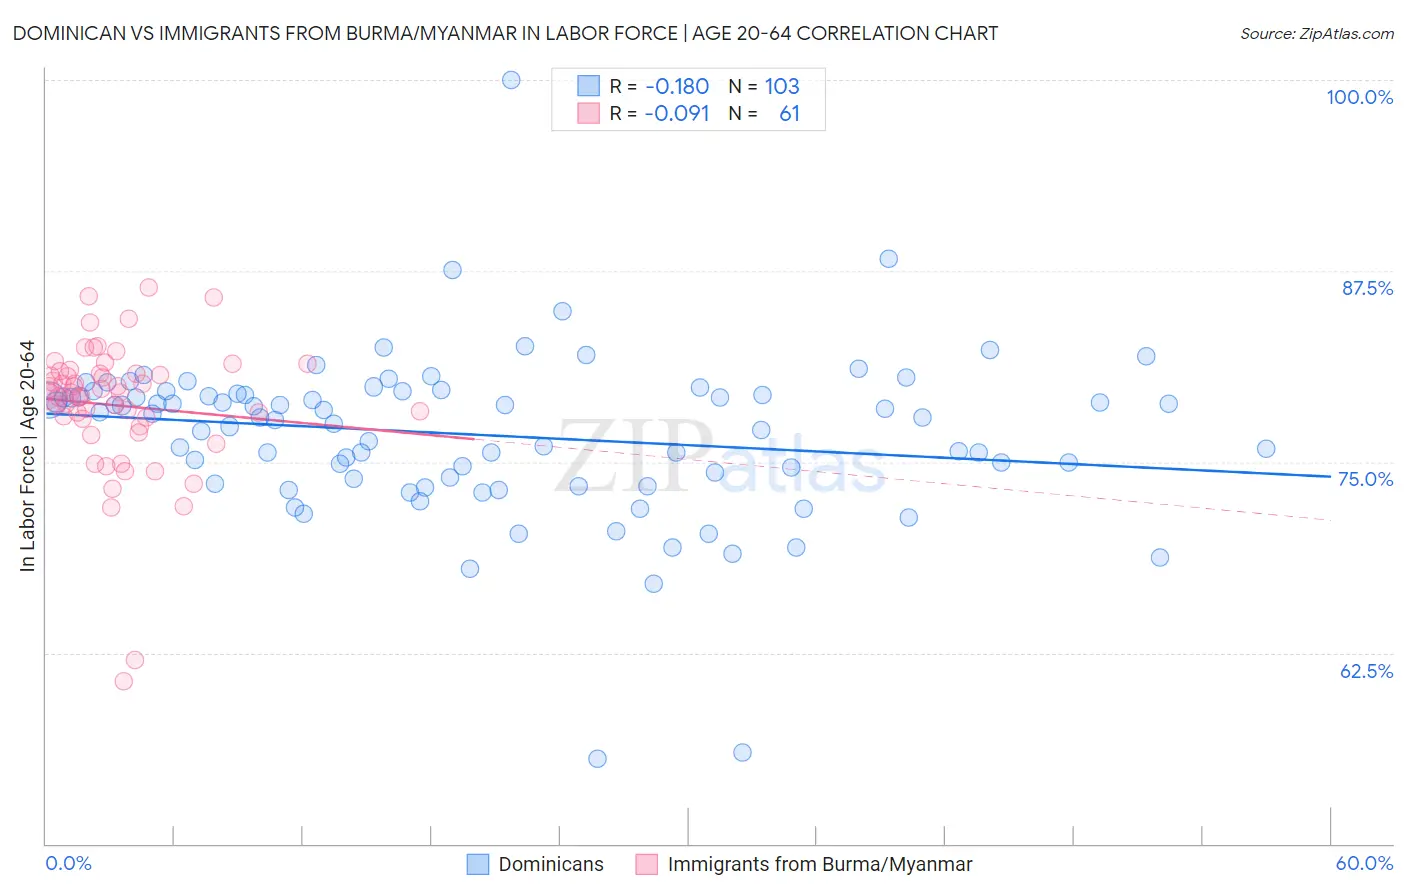
Dominican vs Immigrants from Burma/Myanmar In Labor Force | Age 20-64 Correlation Chart

The statistical analysis conducted on geographies consisting of 355,150,221 people shows a poor negative correlation between the proportion of Dominicans and labor force participation rate among population between the ages 20 and 64 in the United States with a correlation coefficient (R) of -0.180 and weighted average of 77.7%. Similarly, the statistical analysis conducted on geographies consisting of 172,360,396 people shows a slight negative correlation between the proportion of Immigrants from Burma/Myanmar and labor force participation rate among population between the ages 20 and 64 in the United States with a correlation coefficient (R) of -0.091 and weighted average of 79.7%, a difference of 2.6%.
Dominican vs Immigrants from Burma/Myanmar In Labor Force | Age 20-64

In Labor Force | Age 20-64 Correlation Summary

MeasurementDominicanImmigrants from Burma/Myanmar
Minimum55.6%60.6%
Maximum100.0%86.4%
Range44.4%25.8%
Mean76.8%78.7%
Median77.9%79.5%
Interquartile 25% (IQ1)73.9%77.6%
Interquartile 75% (IQ3)79.5%80.9%
Interquartile Range (IQR)5.6%3.3%
Standard Deviation (Sample)5.5%4.5%
Standard Deviation (Population)5.4%4.5%

Similar Demographics by In Labor Force | Age 20-64

Demographics Similar to Dominicans by In Labor Force | Age 20-64

In terms of in labor force | age 20-64, the demographic groups most similar to Dominicans are Immigrants from Dominican Republic (77.7%, a difference of 0.010%), Cree (77.7%, a difference of 0.010%), Immigrants from Grenada (77.7%, a difference of 0.040%), Immigrants from Central America (77.7%, a difference of 0.070%), and Hispanic or Latino (77.6%, a difference of 0.070%).
DemographicsRating | RankIn Labor Force | Age 20-64
Immigrants | Bangladesh
0.0
/100
|
#290
Tragic
77.9%
Spanish Americans
0.0
/100
|
#291
Tragic
77.8%
Immigrants | Azores
0.0
/100
|
#292
Tragic
77.8%
Delaware
0.0
/100
|
#293
Tragic
77.8%
Immigrants | Central America
0.0
/100
|
#294
Tragic
77.7%
Immigrants | Grenada
0.0
/100
|
#295
Tragic
77.7%
Immigrants | Dominican Republic
0.0
/100
|
#296
Tragic
77.7%
Dominicans
0.0
/100
|
#297
Tragic
77.7%
Cree
0.0
/100
|
#298
Tragic
77.7%
Hispanics or Latinos
0.0
/100
|
#299
Tragic
77.6%
Spanish American Indians
0.0
/100
|
#300
Tragic
77.6%
Nepalese
0.0
/100
|
#301
Tragic
77.5%
Iroquois
0.0
/100
|
#302
Tragic
77.5%
Chippewa
0.0
/100
|
#303
Tragic
77.3%
Immigrants | Mexico
0.0
/100
|
#304
Tragic
77.3%

Demographics Similar to Immigrants from Burma/Myanmar by In Labor Force | Age 20-64

In terms of in labor force | age 20-64, the demographic groups most similar to Immigrants from Burma/Myanmar are Immigrants from Costa Rica (79.7%, a difference of 0.0%), Nigerian (79.7%, a difference of 0.0%), German (79.7%, a difference of 0.010%), Okinawan (79.6%, a difference of 0.010%), and Immigrants from Cuba (79.7%, a difference of 0.020%).
DemographicsRating | RankIn Labor Force | Age 20-64
Immigrants | China
69.1
/100
|
#157
Good
79.7%
Austrians
67.6
/100
|
#158
Good
79.7%
Immigrants | Cuba
66.7
/100
|
#159
Good
79.7%
Moroccans
66.7
/100
|
#160
Good
79.7%
South Africans
66.2
/100
|
#161
Good
79.7%
Germans
65.2
/100
|
#162
Good
79.7%
Immigrants | Costa Rica
64.6
/100
|
#163
Good
79.7%
Immigrants | Burma/Myanmar
64.4
/100
|
#164
Good
79.7%
Nigerians
64.0
/100
|
#165
Good
79.7%
Okinawans
62.7
/100
|
#166
Good
79.6%
Immigrants | Iraq
62.0
/100
|
#167
Good
79.6%
Immigrants | Indonesia
61.8
/100
|
#168
Good
79.6%
Laotians
58.4
/100
|
#169
Average
79.6%
Slavs
54.0
/100
|
#170
Average
79.6%
Immigrants | Switzerland
53.3
/100
|
#171
Average
79.6%