Icelander vs Immigrants from Burma/Myanmar Female Poverty Among 25-34 Year Olds

COMPARE

Icelander
Race
Ancestry
AfghanAfricanAlaska NativeAlaskan AthabascanAlbanianAleutAlsatianAmericanApacheArabArapahoArgentineanArmenianAssyrian/Chaldean/SyriacAustralianAustrianBahamianBangladeshiBarbadianBasqueBelgianBelizeanBermudanBhutaneseBlackfeetBolivianBrazilianBritishBritish West IndianBulgarianBurmeseCajunCambodianCanadianCape VerdeanCarpatho RusynCelticCentral AmericanCentral American IndianCherokeeCheyenneChickasawChileanChineseChippewaChoctawColombianColvilleComancheCosta RicanCreeCreekCroatianCrowCubanCypriotCzechCzechoslovakianDanishDelawareDominicanDutchDutch West IndianEastern EuropeanEcuadorianEgyptianEnglishEstonianEthiopianEuropeanFijianFilipinoFinnishFrenchFrench American IndianFrench CanadianGermanGerman RussianGhanaianGreekGuamanian/ChamorroGuatemalanGuyaneseHaitianHmongHonduranHopiHoumaHungarianIcelanderIndian (Asian)IndonesianInupiatIranianIraqiIrishIroquoisIsraeliItalianJamaicanJapaneseJordanianKenyanKiowaKoreanLaotianLatvianLebaneseLiberianLithuanianLumbeeLuxembourgerMacedonianMalaysianMalteseMarshalleseMenomineeMexicanMexican American IndianMongolianMoroccanNative HawaiianNavajoNepaleseNew ZealanderNicaraguanNigerianNorthern EuropeanNorwegianOkinawanOsageOttawaPaiutePakistaniPalestinianPanamanianParaguayanPennsylvania GermanPeruvianPimaPolishPortuguesePotawatomiPuebloPuerto RicanPuget Sound SalishRomanianRussianSalvadoranSamoanScandinavianScotch-IrishScottishSeminoleSenegaleseSerbianShoshoneSierra LeoneanSiouxSlavicSlovakSloveneSomaliSouth AfricanSouth AmericanSouth American IndianSoviet UnionSpaniardSpanishSpanish AmericanSpanish American IndianSri LankanSubsaharan AfricanSudaneseSwedishSwissSyrianTaiwaneseThaiTlingit-HaidaTohono O'OdhamTonganTrinidadian and TobagonianTsimshianTurkishU.S. Virgin IslanderUgandanUkrainianUruguayanUteVenezuelanVietnameseWelshWest IndianYakamaYaquiYugoslavianYumanYup'ikZimbabwean
Immigration
NonimmigrantsImmigrantsAfghanistanAfricaAlbaniaArgentinaArmeniaAsiaAustraliaAustriaBahamasBangladeshBarbadosBelarusBelgiumBelizeBoliviaBosnia and HerzegovinaBrazilBulgariaCabo VerdeCambodiaCameroonCanadaCaribbeanCentral AmericaChileChinaColombiaCongoCosta RicaCroatiaCubaCzechoslovakiaDenmarkDominicaDominican RepublicEastern AfricaEastern AsiaEastern EuropeEcuadorEgyptEl SalvadorEnglandEritreaEthiopiaEuropeFijiFranceGermanyGhanaGreeceGrenadaGuatemalaGuyanaHaitiHondurasHong KongHungaryIndiaIndonesiaIranIraqIrelandIsraelItalyJamaicaJapanJordanKazakhstanKenyaKoreaKuwaitLaosLatin AmericaLatviaLebanonLiberiaLithuaniaMalaysiaMexicoMicronesiaMiddle AfricaMoldovaMoroccoNepalNetherlandsNicaraguaNigeriaNorth AmericaNorth MacedoniaNorthern AfricaNorthern EuropeNorwayOceaniaPakistanPanamaPeruPhilippinesPolandPortugalRomaniaRussiaSaudi ArabiaScotlandSenegalSerbiaSierra LeoneSingaporeSomaliaSouth AfricaSouth AmericaSouth Central AsiaSouth Eastern AsiaSouthern EuropeSpainSri LankaSt. Vincent and the GrenadinesSudanSwedenSwitzerlandSyriaTaiwanThailandTrinidad and TobagoTurkeyUgandaUkraineUruguayUzbekistanVenezuelaVietnamWest IndiesWestern AfricaWestern AsiaWestern EuropeYemenZaireZimbabweAzores
Immigrants from Burma/Myanmar
Race
Ancestry
AfghanAfricanAlaska NativeAlaskan AthabascanAlbanianAleutAlsatianAmericanApacheArabArapahoArgentineanArmenianAssyrian/Chaldean/SyriacAustralianAustrianBahamianBangladeshiBarbadianBasqueBelgianBelizeanBermudanBhutaneseBlackfeetBolivianBrazilianBritishBritish West IndianBulgarianBurmeseCajunCambodianCanadianCape VerdeanCarpatho RusynCelticCentral AmericanCentral American IndianCherokeeCheyenneChickasawChileanChineseChippewaChoctawColombianColvilleComancheCosta RicanCreeCreekCroatianCrowCubanCypriotCzechCzechoslovakianDanishDelawareDominicanDutchDutch West IndianEastern EuropeanEcuadorianEgyptianEnglishEstonianEthiopianEuropeanFijianFilipinoFinnishFrenchFrench American IndianFrench CanadianGermanGerman RussianGhanaianGreekGuamanian/ChamorroGuatemalanGuyaneseHaitianHmongHonduranHopiHoumaHungarianIndian (Asian)IndonesianInupiatIranianIraqiIrishIroquoisIsraeliItalianJamaicanJapaneseJordanianKenyanKiowaKoreanLaotianLatvianLebaneseLiberianLithuanianLumbeeLuxembourgerMacedonianMalaysianMalteseMarshalleseMenomineeMexicanMexican American IndianMongolianMoroccanNative HawaiianNavajoNepaleseNew ZealanderNicaraguanNigerianNorthern EuropeanNorwegianOkinawanOsageOttawaPaiutePakistaniPalestinianPanamanianParaguayanPennsylvania GermanPeruvianPimaPolishPortuguesePotawatomiPuebloPuerto RicanPuget Sound SalishRomanianRussianSalvadoranSamoanScandinavianScotch-IrishScottishSeminoleSenegaleseSerbianShoshoneSierra LeoneanSiouxSlavicSlovakSloveneSomaliSouth AfricanSouth AmericanSouth American IndianSoviet UnionSpaniardSpanishSpanish AmericanSpanish American IndianSri LankanSubsaharan AfricanSudaneseSwedishSwissSyrianTaiwaneseThaiTlingit-HaidaTohono O'OdhamTonganTrinidadian and TobagonianTsimshianTurkishU.S. Virgin IslanderUgandanUkrainianUruguayanUteVenezuelanVietnameseWelshWest IndianYakamaYaquiYugoslavianYumanYup'ikZimbabwean
Immigration
NonimmigrantsImmigrantsAfghanistanAfricaAlbaniaArgentinaArmeniaAsiaAustraliaAustriaBahamasBangladeshBarbadosBelarusBelgiumBelizeBoliviaBosnia and HerzegovinaBrazilBulgariaBurma/MyanmarCabo VerdeCambodiaCameroonCanadaCaribbeanCentral AmericaChileChinaColombiaCongoCosta RicaCroatiaCubaCzechoslovakiaDenmarkDominicaDominican RepublicEastern AfricaEastern AsiaEastern EuropeEcuadorEgyptEl SalvadorEnglandEritreaEthiopiaEuropeFijiFranceGermanyGhanaGreeceGrenadaGuatemalaGuyanaHaitiHondurasHong KongHungaryIndiaIndonesiaIranIraqIrelandIsraelItalyJamaicaJapanJordanKazakhstanKenyaKoreaKuwaitLaosLatin AmericaLatviaLebanonLiberiaLithuaniaMalaysiaMexicoMicronesiaMiddle AfricaMoldovaMoroccoNepalNetherlandsNicaraguaNigeriaNorth AmericaNorth MacedoniaNorthern AfricaNorthern EuropeNorwayOceaniaPakistanPanamaPeruPhilippinesPolandPortugalRomaniaRussiaSaudi ArabiaScotlandSenegalSerbiaSierra LeoneSingaporeSomaliaSouth AfricaSouth AmericaSouth Central AsiaSouth Eastern AsiaSouthern EuropeSpainSri LankaSt. Vincent and the GrenadinesSudanSwedenSwitzerlandSyriaTaiwanThailandTrinidad and TobagoTurkeyUgandaUkraineUruguayUzbekistanVenezuelaVietnamWest IndiesWestern AfricaWestern AsiaWestern EuropeYemenZaireZimbabweAzores
Female Poverty Among 25-34 Year Olds
Income
Poverty
Unemployment
Labor Participation
Family Structure
Vehicle Availability
Education Level
Disability

Female Poverty Among 25-34 Year Olds Comparison

Icelanders

Immigrants from Burma/Myanmar

Good
Tragic
13.3%
FEMALE POVERTY AMONG 25-34 YEAR OLDS
65.7/ 100
METRIC RATING
161st/ 347
METRIC RANK
15.2%
FEMALE POVERTY AMONG 25-34 YEAR OLDS
0.3/ 100
METRIC RATING
257th/ 347
METRIC RANK

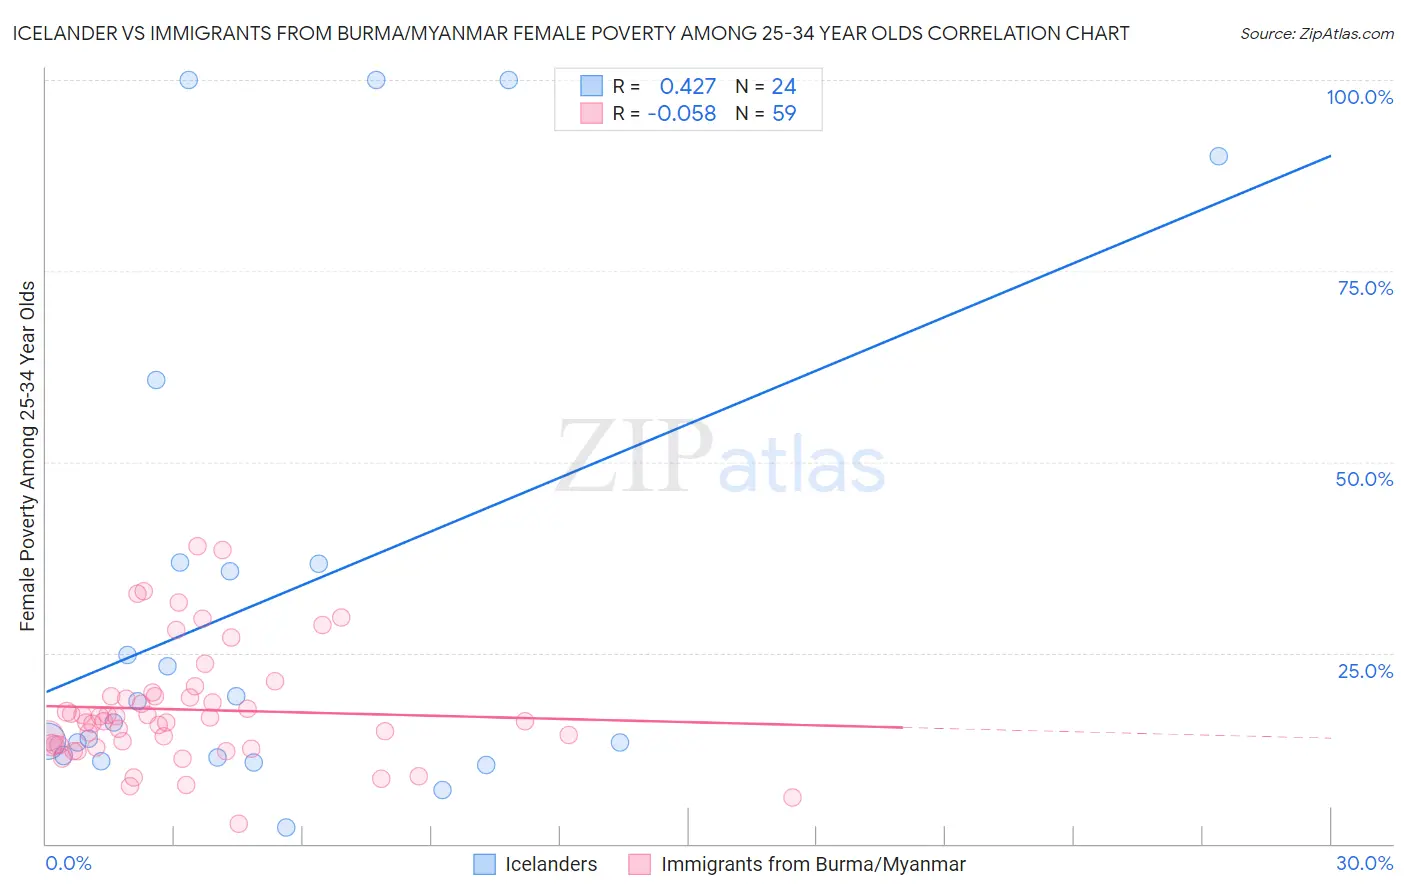
Icelander vs Immigrants from Burma/Myanmar Female Poverty Among 25-34 Year Olds Correlation Chart

The statistical analysis conducted on geographies consisting of 158,293,489 people shows a moderate positive correlation between the proportion of Icelanders and poverty level among females between the ages 25 and 34 in the United States with a correlation coefficient (R) of 0.427 and weighted average of 13.3%. Similarly, the statistical analysis conducted on geographies consisting of 171,442,894 people shows a slight negative correlation between the proportion of Immigrants from Burma/Myanmar and poverty level among females between the ages 25 and 34 in the United States with a correlation coefficient (R) of -0.058 and weighted average of 15.2%, a difference of 13.7%.
Icelander vs Immigrants from Burma/Myanmar Female Poverty Among 25-34 Year Olds

Female Poverty Among 25-34 Year Olds Correlation Summary

MeasurementIcelanderImmigrants from Burma/Myanmar
Minimum2.1%2.6%
Maximum100.0%39.0%
Range97.9%36.4%
Mean32.5%17.6%
Median17.3%16.0%
Interquartile 25% (IQ1)11.4%12.9%
Interquartile 75% (IQ3)36.8%19.4%
Interquartile Range (IQR)25.4%6.5%
Standard Deviation (Sample)32.3%7.7%
Standard Deviation (Population)31.6%7.6%

Similar Demographics by Female Poverty Among 25-34 Year Olds

Demographics Similar to Icelanders by Female Poverty Among 25-34 Year Olds

In terms of female poverty among 25-34 year olds, the demographic groups most similar to Icelanders are Immigrants from South America (13.3%, a difference of 0.060%), Uruguayan (13.3%, a difference of 0.12%), Ugandan (13.4%, a difference of 0.15%), British (13.4%, a difference of 0.20%), and Immigrants from Colombia (13.3%, a difference of 0.34%).
DemographicsRating | RankFemale Poverty Among 25-34 Year Olds
Arabs
73.5
/100
|
#154
Good
13.2%
Immigrants | Sierra Leone
72.9
/100
|
#155
Good
13.3%
Immigrants | Cameroon
72.0
/100
|
#156
Good
13.3%
Immigrants | Western Europe
70.3
/100
|
#157
Good
13.3%
Immigrants | Colombia
69.2
/100
|
#158
Good
13.3%
Uruguayans
66.9
/100
|
#159
Good
13.3%
Immigrants | South America
66.3
/100
|
#160
Good
13.3%
Icelanders
65.7
/100
|
#161
Good
13.3%
Ugandans
64.1
/100
|
#162
Good
13.4%
British
63.5
/100
|
#163
Good
13.4%
Swiss
61.7
/100
|
#164
Good
13.4%
Basques
59.3
/100
|
#165
Average
13.4%
Belgians
58.9
/100
|
#166
Average
13.4%
Immigrants | Bosnia and Herzegovina
58.6
/100
|
#167
Average
13.4%
Immigrants | Afghanistan
57.7
/100
|
#168
Average
13.4%

Demographics Similar to Immigrants from Burma/Myanmar by Female Poverty Among 25-34 Year Olds

In terms of female poverty among 25-34 year olds, the demographic groups most similar to Immigrants from Burma/Myanmar are West Indian (15.2%, a difference of 0.020%), Immigrants from Laos (15.2%, a difference of 0.19%), Nepalese (15.2%, a difference of 0.25%), Immigrants from Cuba (15.2%, a difference of 0.28%), and Somali (15.1%, a difference of 0.58%).
DemographicsRating | RankFemale Poverty Among 25-34 Year Olds
Immigrants | El Salvador
0.5
/100
|
#250
Tragic
15.0%
Haitians
0.5
/100
|
#251
Tragic
15.0%
Belizeans
0.4
/100
|
#252
Tragic
15.1%
Immigrants | West Indies
0.4
/100
|
#253
Tragic
15.1%
Somalis
0.4
/100
|
#254
Tragic
15.1%
Immigrants | Laos
0.3
/100
|
#255
Tragic
15.2%
West Indians
0.3
/100
|
#256
Tragic
15.2%
Immigrants | Burma/Myanmar
0.3
/100
|
#257
Tragic
15.2%
Nepalese
0.2
/100
|
#258
Tragic
15.2%
Immigrants | Cuba
0.2
/100
|
#259
Tragic
15.2%
Marshallese
0.2
/100
|
#260
Tragic
15.3%
Liberians
0.2
/100
|
#261
Tragic
15.3%
Immigrants | Belize
0.2
/100
|
#262
Tragic
15.3%
Mexican American Indians
0.2
/100
|
#263
Tragic
15.4%
Pennsylvania Germans
0.1
/100
|
#264
Tragic
15.4%