Immigrants from Eastern Asia vs Immigrants from Burma/Myanmar Female Poverty Among 25-34 Year Olds
COMPARE
Immigrants from Eastern Asia
Immigrants from Burma/Myanmar
Female Poverty Among 25-34 Year Olds
Female Poverty Among 25-34 Year Olds Comparison
Immigrants from Eastern Asia
Immigrants from Burma/Myanmar
11.2%
FEMALE POVERTY AMONG 25-34 YEAR OLDS
100.0/ 100
METRIC RATING
18th/ 347
METRIC RANK
15.2%
FEMALE POVERTY AMONG 25-34 YEAR OLDS
0.3/ 100
METRIC RATING
257th/ 347
METRIC RANK
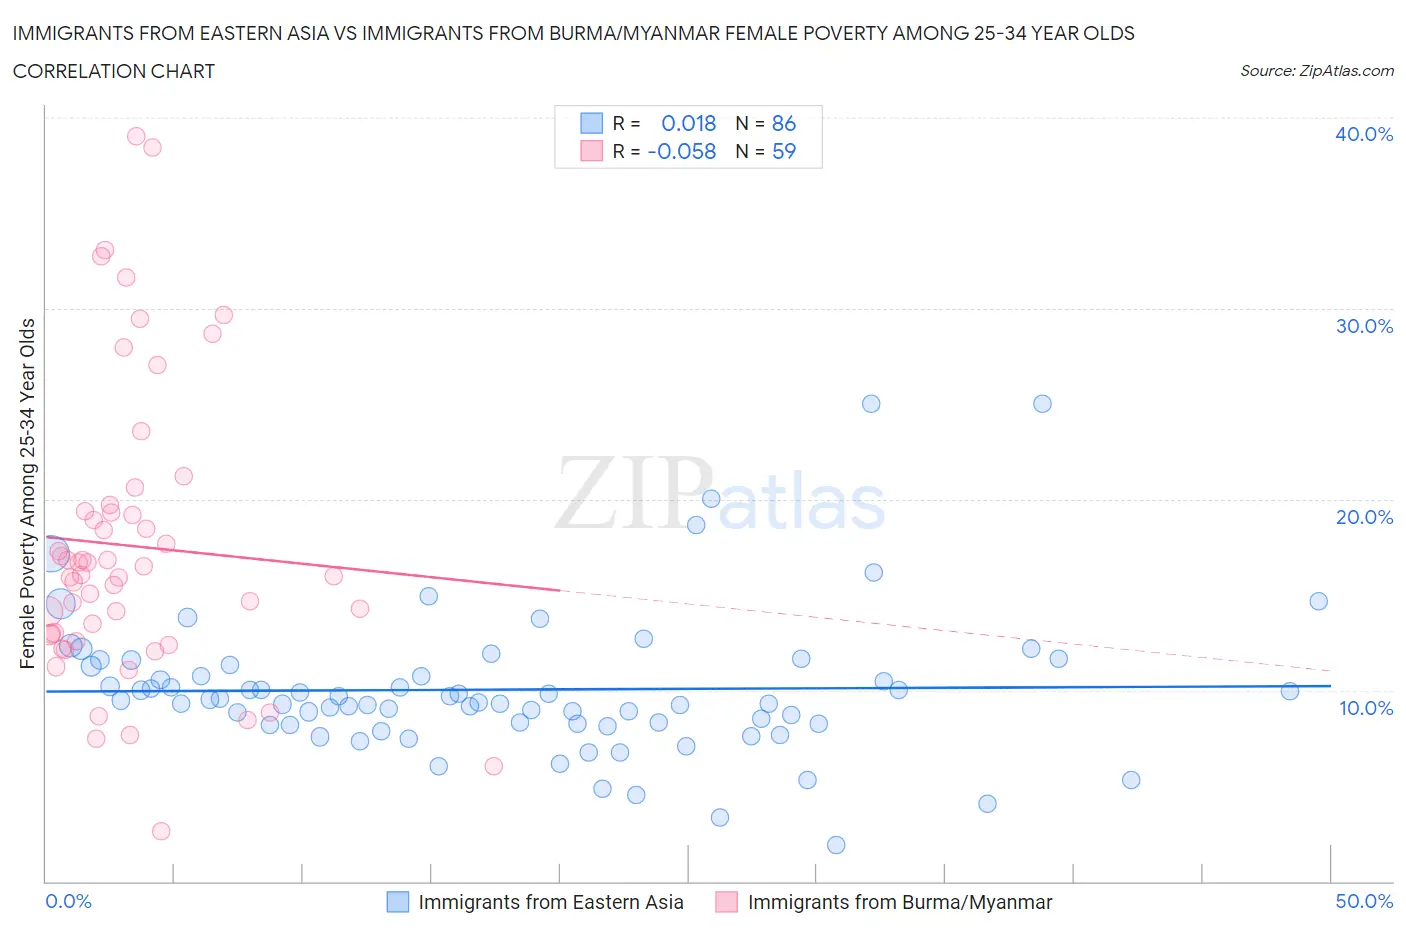
Immigrants from Eastern Asia vs Immigrants from Burma/Myanmar Female Poverty Among 25-34 Year Olds Correlation Chart
The statistical analysis conducted on geographies consisting of 486,963,543 people shows no correlation between the proportion of Immigrants from Eastern Asia and poverty level among females between the ages 25 and 34 in the United States with a correlation coefficient (R) of 0.018 and weighted average of 11.2%. Similarly, the statistical analysis conducted on geographies consisting of 171,442,894 people shows a slight negative correlation between the proportion of Immigrants from Burma/Myanmar and poverty level among females between the ages 25 and 34 in the United States with a correlation coefficient (R) of -0.058 and weighted average of 15.2%, a difference of 35.4%.
Female Poverty Among 25-34 Year Olds Correlation Summary
| Measurement | Immigrants from Eastern Asia | Immigrants from Burma/Myanmar |
| Minimum | 1.9% | 2.6% |
| Maximum | 25.0% | 39.0% |
| Range | 23.1% | 36.4% |
| Mean | 10.0% | 17.6% |
| Median | 9.4% | 16.0% |
| Interquartile 25% (IQ1) | 8.2% | 12.9% |
| Interquartile 75% (IQ3) | 11.3% | 19.4% |
| Interquartile Range (IQR) | 3.0% | 6.5% |
| Standard Deviation (Sample) | 3.8% | 7.7% |
| Standard Deviation (Population) | 3.8% | 7.6% |
Similar Demographics by Female Poverty Among 25-34 Year Olds
Demographics Similar to Immigrants from Eastern Asia by Female Poverty Among 25-34 Year Olds
In terms of female poverty among 25-34 year olds, the demographic groups most similar to Immigrants from Eastern Asia are Immigrants from China (11.2%, a difference of 0.11%), Iranian (11.2%, a difference of 0.14%), Immigrants from Bolivia (11.2%, a difference of 0.18%), Assyrian/Chaldean/Syriac (11.2%, a difference of 0.22%), and Burmese (11.2%, a difference of 0.33%).
| Demographics | Rating | Rank | Female Poverty Among 25-34 Year Olds |
| Immigrants | Korea | 100.0 /100 | #11 | Exceptional 11.1% |
| Immigrants | Ireland | 100.0 /100 | #12 | Exceptional 11.2% |
| Burmese | 100.0 /100 | #13 | Exceptional 11.2% |
| Indians (Asian) | 100.0 /100 | #14 | Exceptional 11.2% |
| Assyrians/Chaldeans/Syriacs | 100.0 /100 | #15 | Exceptional 11.2% |
| Immigrants | Bolivia | 100.0 /100 | #16 | Exceptional 11.2% |
| Immigrants | China | 100.0 /100 | #17 | Exceptional 11.2% |
| Immigrants | Eastern Asia | 100.0 /100 | #18 | Exceptional 11.2% |
| Iranians | 100.0 /100 | #19 | Exceptional 11.2% |
| Okinawans | 100.0 /100 | #20 | Exceptional 11.3% |
| Turks | 100.0 /100 | #21 | Exceptional 11.4% |
| Asians | 99.9 /100 | #22 | Exceptional 11.4% |
| Bolivians | 99.9 /100 | #23 | Exceptional 11.4% |
| Maltese | 99.9 /100 | #24 | Exceptional 11.4% |
| Bhutanese | 99.9 /100 | #25 | Exceptional 11.4% |
Demographics Similar to Immigrants from Burma/Myanmar by Female Poverty Among 25-34 Year Olds
In terms of female poverty among 25-34 year olds, the demographic groups most similar to Immigrants from Burma/Myanmar are West Indian (15.2%, a difference of 0.020%), Immigrants from Laos (15.2%, a difference of 0.19%), Nepalese (15.2%, a difference of 0.25%), Immigrants from Cuba (15.2%, a difference of 0.28%), and Somali (15.1%, a difference of 0.58%).
| Demographics | Rating | Rank | Female Poverty Among 25-34 Year Olds |
| Immigrants | El Salvador | 0.5 /100 | #250 | Tragic 15.0% |
| Haitians | 0.5 /100 | #251 | Tragic 15.0% |
| Belizeans | 0.4 /100 | #252 | Tragic 15.1% |
| Immigrants | West Indies | 0.4 /100 | #253 | Tragic 15.1% |
| Somalis | 0.4 /100 | #254 | Tragic 15.1% |
| Immigrants | Laos | 0.3 /100 | #255 | Tragic 15.2% |
| West Indians | 0.3 /100 | #256 | Tragic 15.2% |
| Immigrants | Burma/Myanmar | 0.3 /100 | #257 | Tragic 15.2% |
| Nepalese | 0.2 /100 | #258 | Tragic 15.2% |
| Immigrants | Cuba | 0.2 /100 | #259 | Tragic 15.2% |
| Marshallese | 0.2 /100 | #260 | Tragic 15.3% |
| Liberians | 0.2 /100 | #261 | Tragic 15.3% |
| Immigrants | Belize | 0.2 /100 | #262 | Tragic 15.3% |
| Mexican American Indians | 0.2 /100 | #263 | Tragic 15.4% |
| Pennsylvania Germans | 0.1 /100 | #264 | Tragic 15.4% |