Dominican vs Venezuelan Female Poverty Among 25-34 Year Olds
COMPARE
Dominican
Venezuelan
Female Poverty Among 25-34 Year Olds
Female Poverty Among 25-34 Year Olds Comparison
Dominicans
Venezuelans
17.6%
FEMALE POVERTY AMONG 25-34 YEAR OLDS
0.0/ 100
METRIC RATING
316th/ 347
METRIC RANK
13.6%
FEMALE POVERTY AMONG 25-34 YEAR OLDS
44.6/ 100
METRIC RATING
177th/ 347
METRIC RANK
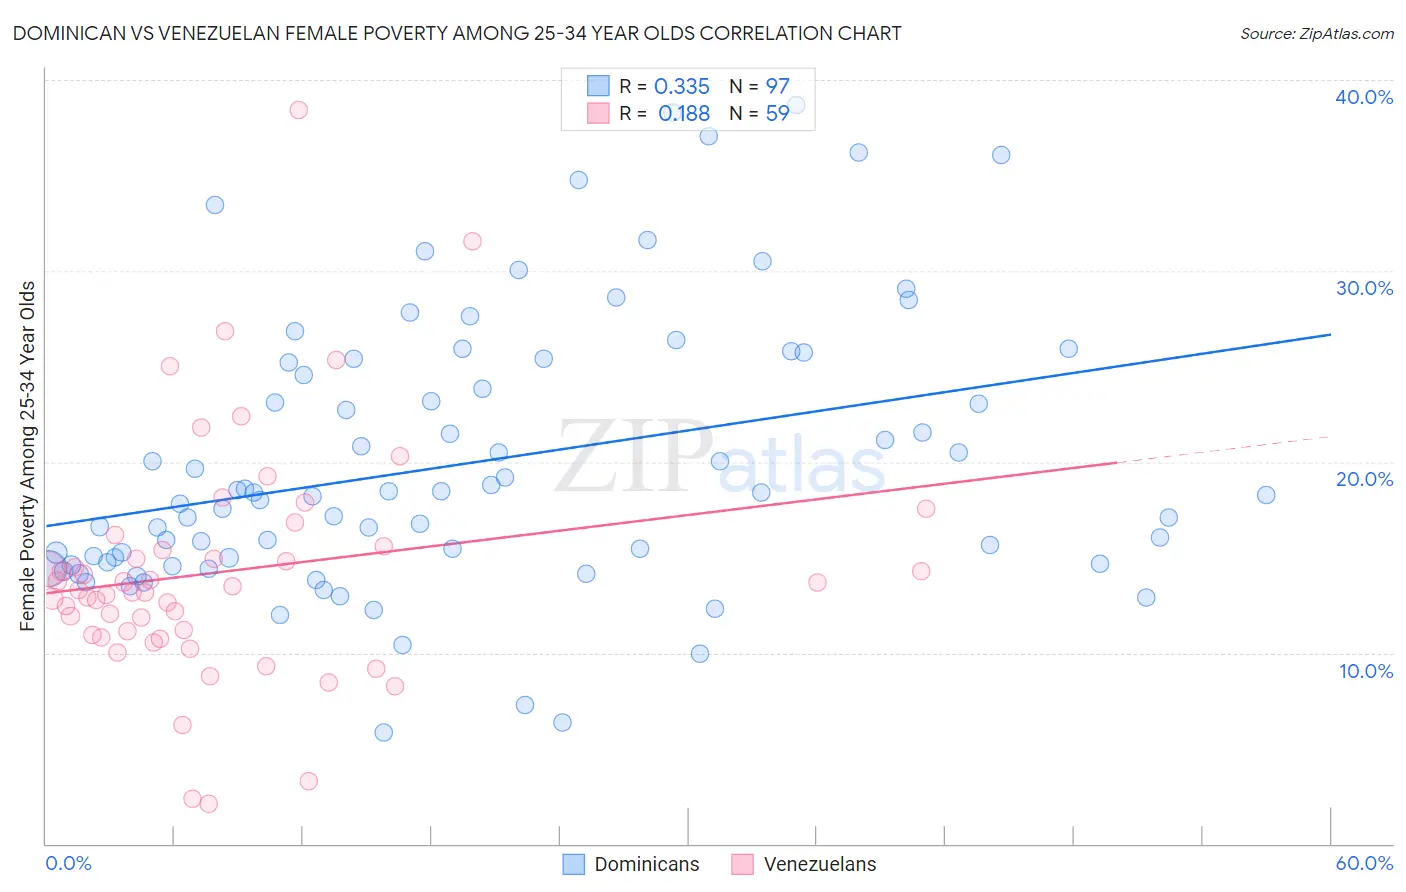
Dominican vs Venezuelan Female Poverty Among 25-34 Year Olds Correlation Chart
The statistical analysis conducted on geographies consisting of 350,065,024 people shows a mild positive correlation between the proportion of Dominicans and poverty level among females between the ages 25 and 34 in the United States with a correlation coefficient (R) of 0.335 and weighted average of 17.6%. Similarly, the statistical analysis conducted on geographies consisting of 303,104,079 people shows a poor positive correlation between the proportion of Venezuelans and poverty level among females between the ages 25 and 34 in the United States with a correlation coefficient (R) of 0.188 and weighted average of 13.6%, a difference of 29.7%.
Female Poverty Among 25-34 Year Olds Correlation Summary
| Measurement | Dominican | Venezuelan |
| Minimum | 5.8% | 2.1% |
| Maximum | 38.7% | 38.5% |
| Range | 32.9% | 36.3% |
| Mean | 19.9% | 14.3% |
| Median | 18.3% | 13.3% |
| Interquartile 25% (IQ1) | 14.7% | 10.9% |
| Interquartile 75% (IQ3) | 25.3% | 15.6% |
| Interquartile Range (IQR) | 10.6% | 4.7% |
| Standard Deviation (Sample) | 7.2% | 6.3% |
| Standard Deviation (Population) | 7.2% | 6.2% |
Similar Demographics by Female Poverty Among 25-34 Year Olds
Demographics Similar to Dominicans by Female Poverty Among 25-34 Year Olds
In terms of female poverty among 25-34 year olds, the demographic groups most similar to Dominicans are Yakama (17.6%, a difference of 0.0%), Immigrants from Dominican Republic (17.6%, a difference of 0.22%), Arapaho (17.8%, a difference of 0.79%), Colville (17.5%, a difference of 0.90%), and Iroquois (17.5%, a difference of 0.98%).
| Demographics | Rating | Rank | Female Poverty Among 25-34 Year Olds |
| Ottawa | 0.0 /100 | #309 | Tragic 17.1% |
| Cherokee | 0.0 /100 | #310 | Tragic 17.2% |
| Immigrants | Honduras | 0.0 /100 | #311 | Tragic 17.3% |
| Iroquois | 0.0 /100 | #312 | Tragic 17.5% |
| Colville | 0.0 /100 | #313 | Tragic 17.5% |
| Immigrants | Dominican Republic | 0.0 /100 | #314 | Tragic 17.6% |
| Yakama | 0.0 /100 | #315 | Tragic 17.6% |
| Dominicans | 0.0 /100 | #316 | Tragic 17.6% |
| Arapaho | 0.0 /100 | #317 | Tragic 17.8% |
| Ute | 0.0 /100 | #318 | Tragic 17.9% |
| Menominee | 0.0 /100 | #319 | Tragic 18.0% |
| Chippewa | 0.0 /100 | #320 | Tragic 18.0% |
| Choctaw | 0.0 /100 | #321 | Tragic 18.1% |
| Central American Indians | 0.0 /100 | #322 | Tragic 18.2% |
| Seminole | 0.0 /100 | #323 | Tragic 18.3% |
Demographics Similar to Venezuelans by Female Poverty Among 25-34 Year Olds
In terms of female poverty among 25-34 year olds, the demographic groups most similar to Venezuelans are Yugoslavian (13.6%, a difference of 0.030%), Canadian (13.6%, a difference of 0.030%), Immigrants from Eastern Africa (13.6%, a difference of 0.090%), Bermudan (13.6%, a difference of 0.18%), and German (13.6%, a difference of 0.26%).
| Demographics | Rating | Rank | Female Poverty Among 25-34 Year Olds |
| Immigrants | Uganda | 53.0 /100 | #170 | Average 13.5% |
| South American Indians | 51.9 /100 | #171 | Average 13.5% |
| Immigrants | Costa Rica | 51.9 /100 | #172 | Average 13.5% |
| Kenyans | 51.8 /100 | #173 | Average 13.5% |
| Immigrants | Oceania | 50.0 /100 | #174 | Average 13.5% |
| Bermudans | 46.8 /100 | #175 | Average 13.6% |
| Yugoslavians | 45.0 /100 | #176 | Average 13.6% |
| Venezuelans | 44.6 /100 | #177 | Average 13.6% |
| Canadians | 44.3 /100 | #178 | Average 13.6% |
| Immigrants | Eastern Africa | 43.6 /100 | #179 | Average 13.6% |
| Germans | 41.6 /100 | #180 | Average 13.6% |
| Guamanians/Chamorros | 41.5 /100 | #181 | Average 13.6% |
| Immigrants | Venezuela | 40.7 /100 | #182 | Average 13.6% |
| Portuguese | 40.3 /100 | #183 | Average 13.6% |
| Czechoslovakians | 36.8 /100 | #184 | Fair 13.7% |