Danish vs Central American Indian Unemployment Among Seniors over 75 years
COMPARE
Danish
Central American Indian
Unemployment Among Seniors over 75 years
Unemployment Among Seniors over 75 years Comparison
Danes
Central American Indians
9.7%
UNEMPLOYMENT AMONG SENIORS OVER 75 YEARS
0.0/ 100
METRIC RATING
287th/ 347
METRIC RANK
9.2%
UNEMPLOYMENT AMONG SENIORS OVER 75 YEARS
2.2/ 100
METRIC RATING
250th/ 347
METRIC RANK
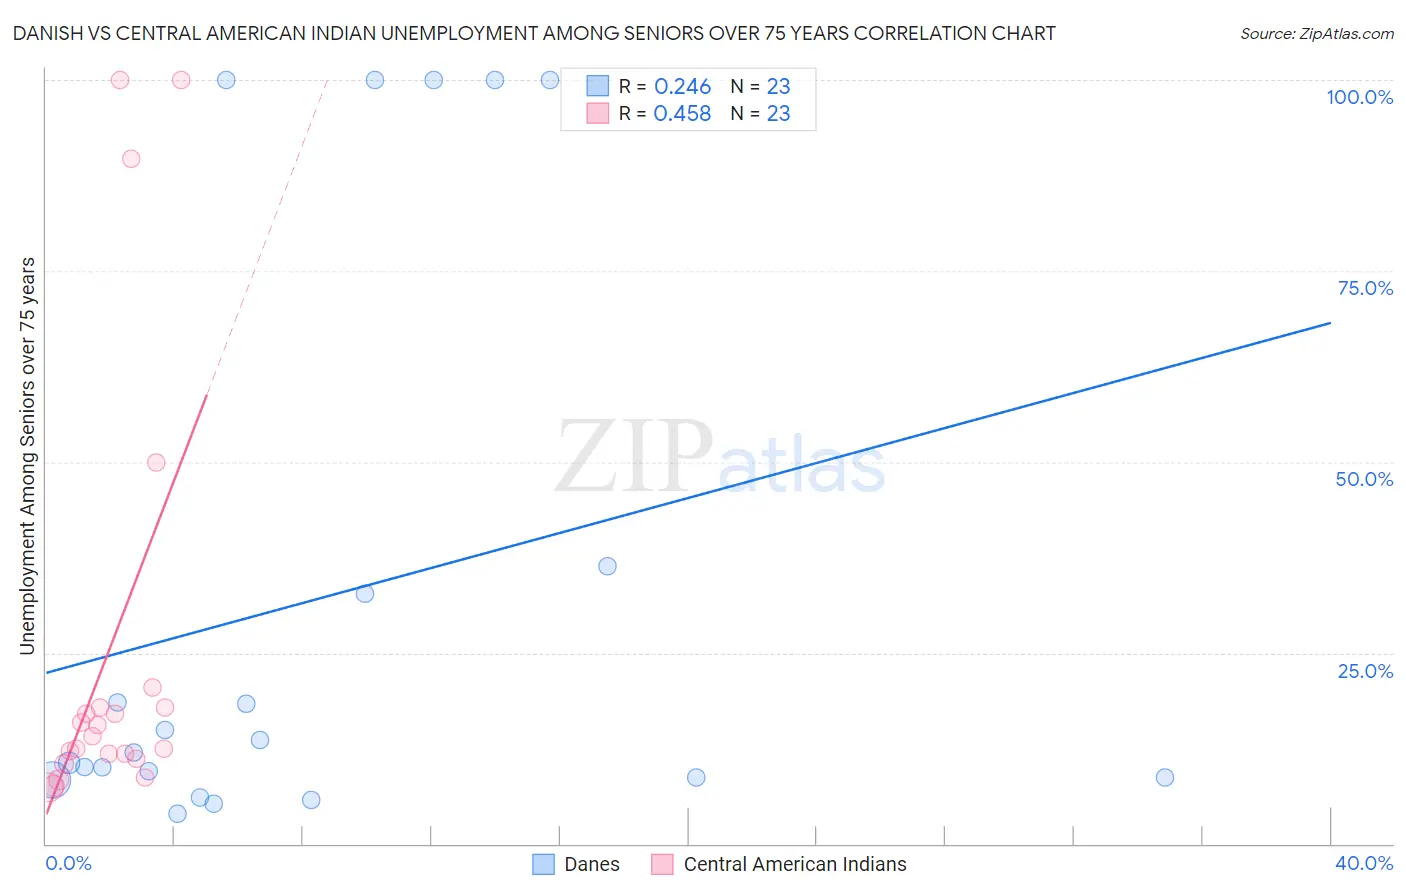
Danish vs Central American Indian Unemployment Among Seniors over 75 years Correlation Chart
The statistical analysis conducted on geographies consisting of 216,837,655 people shows a weak positive correlation between the proportion of Danes and unemployment rate among seniors over the age of 75 in the United States with a correlation coefficient (R) of 0.246 and weighted average of 9.7%. Similarly, the statistical analysis conducted on geographies consisting of 178,666,520 people shows a moderate positive correlation between the proportion of Central American Indians and unemployment rate among seniors over the age of 75 in the United States with a correlation coefficient (R) of 0.458 and weighted average of 9.2%, a difference of 5.3%.
Unemployment Among Seniors over 75 years Correlation Summary
| Measurement | Danish | Central American Indian |
| Minimum | 3.9% | 7.4% |
| Maximum | 100.0% | 100.0% |
| Range | 96.1% | 92.6% |
| Mean | 31.9% | 25.6% |
| Median | 11.9% | 14.0% |
| Interquartile 25% (IQ1) | 8.7% | 11.2% |
| Interquartile 75% (IQ3) | 36.4% | 17.9% |
| Interquartile Range (IQR) | 27.7% | 6.7% |
| Standard Deviation (Sample) | 37.5% | 29.4% |
| Standard Deviation (Population) | 36.7% | 28.7% |
Similar Demographics by Unemployment Among Seniors over 75 years
Demographics Similar to Danes by Unemployment Among Seniors over 75 years
In terms of unemployment among seniors over 75 years, the demographic groups most similar to Danes are Nigerian (9.7%, a difference of 0.11%), Canadian (9.7%, a difference of 0.14%), Carpatho Rusyn (9.7%, a difference of 0.17%), European (9.7%, a difference of 0.20%), and Czech (9.7%, a difference of 0.22%).
| Demographics | Rating | Rank | Unemployment Among Seniors over 75 years |
| Croatians | 0.1 /100 | #280 | Tragic 9.6% |
| Bangladeshis | 0.1 /100 | #281 | Tragic 9.6% |
| Macedonians | 0.0 /100 | #282 | Tragic 9.6% |
| Immigrants | Nigeria | 0.0 /100 | #283 | Tragic 9.6% |
| Europeans | 0.0 /100 | #284 | Tragic 9.7% |
| Carpatho Rusyns | 0.0 /100 | #285 | Tragic 9.7% |
| Nigerians | 0.0 /100 | #286 | Tragic 9.7% |
| Danes | 0.0 /100 | #287 | Tragic 9.7% |
| Canadians | 0.0 /100 | #288 | Tragic 9.7% |
| Czechs | 0.0 /100 | #289 | Tragic 9.7% |
| Sioux | 0.0 /100 | #290 | Tragic 9.7% |
| Scandinavians | 0.0 /100 | #291 | Tragic 9.7% |
| Immigrants | Western Africa | 0.0 /100 | #292 | Tragic 9.8% |
| Norwegians | 0.0 /100 | #293 | Tragic 9.8% |
| Immigrants | Dominica | 0.0 /100 | #294 | Tragic 9.8% |
Demographics Similar to Central American Indians by Unemployment Among Seniors over 75 years
In terms of unemployment among seniors over 75 years, the demographic groups most similar to Central American Indians are Immigrants from Saudi Arabia (9.2%, a difference of 0.010%), Blackfeet (9.2%, a difference of 0.060%), Subsaharan African (9.2%, a difference of 0.10%), Immigrants from Poland (9.2%, a difference of 0.10%), and Immigrants from North America (9.2%, a difference of 0.12%).
| Demographics | Rating | Rank | Unemployment Among Seniors over 75 years |
| Slavs | 2.8 /100 | #243 | Tragic 9.2% |
| Immigrants | Germany | 2.7 /100 | #244 | Tragic 9.2% |
| Immigrants | Canada | 2.6 /100 | #245 | Tragic 9.2% |
| Immigrants | North America | 2.4 /100 | #246 | Tragic 9.2% |
| Sub-Saharan Africans | 2.3 /100 | #247 | Tragic 9.2% |
| Blackfeet | 2.3 /100 | #248 | Tragic 9.2% |
| Immigrants | Saudi Arabia | 2.2 /100 | #249 | Tragic 9.2% |
| Central American Indians | 2.2 /100 | #250 | Tragic 9.2% |
| Immigrants | Poland | 2.0 /100 | #251 | Tragic 9.2% |
| Immigrants | Sudan | 2.0 /100 | #252 | Tragic 9.2% |
| Pima | 1.8 /100 | #253 | Tragic 9.2% |
| Immigrants | Ghana | 1.7 /100 | #254 | Tragic 9.2% |
| Immigrants | Scotland | 1.4 /100 | #255 | Tragic 9.2% |
| Brazilians | 1.3 /100 | #256 | Tragic 9.3% |
| Hawaiians | 1.2 /100 | #257 | Tragic 9.3% |