Czech vs Immigrants from Austria Hearing Disability
COMPARE
Czech
Immigrants from Austria
Hearing Disability
Hearing Disability Comparison
Czechs
Immigrants from Austria
3.5%
HEARING DISABILITY
0.1/ 100
METRIC RATING
271st/ 347
METRIC RANK
3.3%
HEARING DISABILITY
1.8/ 100
METRIC RATING
237th/ 347
METRIC RANK
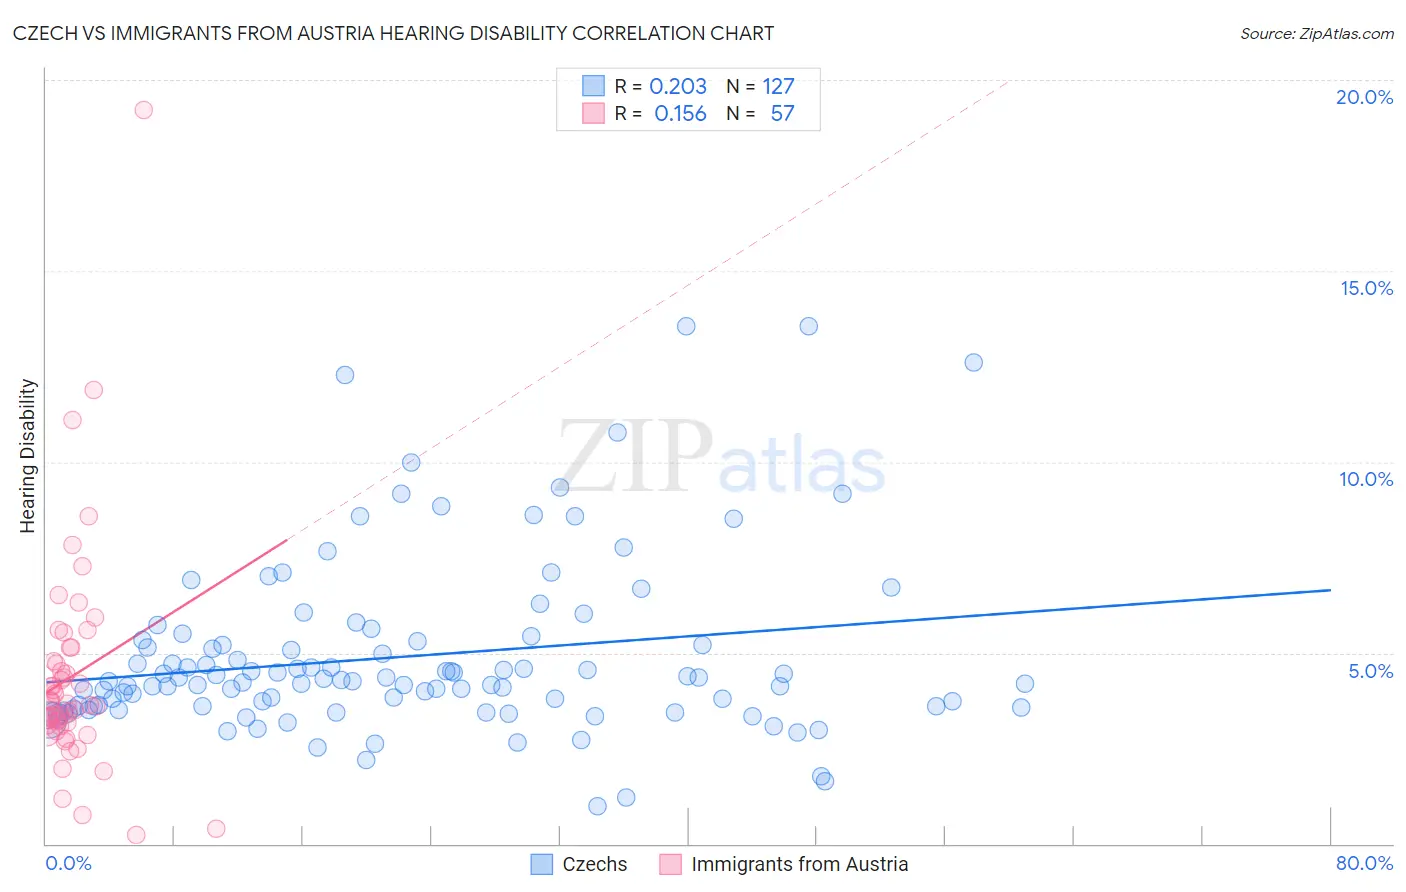
Czech vs Immigrants from Austria Hearing Disability Correlation Chart
The statistical analysis conducted on geographies consisting of 484,559,350 people shows a weak positive correlation between the proportion of Czechs and percentage of population with hearing disability in the United States with a correlation coefficient (R) of 0.203 and weighted average of 3.5%. Similarly, the statistical analysis conducted on geographies consisting of 167,968,666 people shows a poor positive correlation between the proportion of Immigrants from Austria and percentage of population with hearing disability in the United States with a correlation coefficient (R) of 0.156 and weighted average of 3.3%, a difference of 7.5%.
Hearing Disability Correlation Summary
| Measurement | Czech | Immigrants from Austria |
| Minimum | 0.98% | 0.21% |
| Maximum | 13.6% | 19.2% |
| Range | 12.6% | 19.0% |
| Mean | 4.9% | 4.4% |
| Median | 4.3% | 3.7% |
| Interquartile 25% (IQ1) | 3.6% | 3.1% |
| Interquartile 75% (IQ3) | 5.3% | 5.0% |
| Interquartile Range (IQR) | 1.7% | 1.9% |
| Standard Deviation (Sample) | 2.3% | 2.9% |
| Standard Deviation (Population) | 2.3% | 2.9% |
Similar Demographics by Hearing Disability
Demographics Similar to Czechs by Hearing Disability
In terms of hearing disability, the demographic groups most similar to Czechs are European (3.5%, a difference of 0.26%), Fijian (3.5%, a difference of 0.26%), Puerto Rican (3.5%, a difference of 0.33%), Ute (3.5%, a difference of 0.61%), and Swiss (3.5%, a difference of 0.66%).
| Demographics | Rating | Rank | Hearing Disability |
| Immigrants | Germany | 0.1 /100 | #264 | Tragic 3.5% |
| British | 0.1 /100 | #265 | Tragic 3.5% |
| Belgians | 0.1 /100 | #266 | Tragic 3.5% |
| Canadians | 0.1 /100 | #267 | Tragic 3.5% |
| Spaniards | 0.1 /100 | #268 | Tragic 3.5% |
| Ute | 0.1 /100 | #269 | Tragic 3.5% |
| Europeans | 0.1 /100 | #270 | Tragic 3.5% |
| Czechs | 0.1 /100 | #271 | Tragic 3.5% |
| Fijians | 0.0 /100 | #272 | Tragic 3.5% |
| Puerto Ricans | 0.0 /100 | #273 | Tragic 3.5% |
| Swiss | 0.0 /100 | #274 | Tragic 3.5% |
| Czechoslovakians | 0.0 /100 | #275 | Tragic 3.6% |
| Danes | 0.0 /100 | #276 | Tragic 3.6% |
| Immigrants | Nonimmigrants | 0.0 /100 | #277 | Tragic 3.6% |
| Basques | 0.0 /100 | #278 | Tragic 3.6% |
Demographics Similar to Immigrants from Austria by Hearing Disability
In terms of hearing disability, the demographic groups most similar to Immigrants from Austria are German Russian (3.3%, a difference of 0.0%), Serbian (3.3%, a difference of 0.39%), Guamanian/Chamorro (3.3%, a difference of 0.46%), Central American Indian (3.3%, a difference of 0.56%), and Estonian (3.3%, a difference of 0.63%).
| Demographics | Rating | Rank | Hearing Disability |
| Greeks | 3.2 /100 | #230 | Tragic 3.2% |
| Luxembourgers | 2.9 /100 | #231 | Tragic 3.2% |
| Ukrainians | 2.9 /100 | #232 | Tragic 3.2% |
| Estonians | 2.4 /100 | #233 | Tragic 3.3% |
| Central American Indians | 2.3 /100 | #234 | Tragic 3.3% |
| Guamanians/Chamorros | 2.2 /100 | #235 | Tragic 3.3% |
| Serbians | 2.2 /100 | #236 | Tragic 3.3% |
| Immigrants | Austria | 1.8 /100 | #237 | Tragic 3.3% |
| German Russians | 1.8 /100 | #238 | Tragic 3.3% |
| Nepalese | 1.2 /100 | #239 | Tragic 3.3% |
| Immigrants | Netherlands | 1.1 /100 | #240 | Tragic 3.3% |
| Samoans | 1.1 /100 | #241 | Tragic 3.3% |
| Yugoslavians | 1.0 /100 | #242 | Tragic 3.3% |
| Immigrants | Western Europe | 1.0 /100 | #243 | Tragic 3.3% |
| Assyrians/Chaldeans/Syriacs | 0.9 /100 | #244 | Tragic 3.3% |