Czech vs Thai Single Mother Poverty
COMPARE
Czech
Thai
Single Mother Poverty
Single Mother Poverty Comparison
Czechs
Thais
28.9%
SINGLE MOTHER POVERTY
68.4/ 100
METRIC RATING
159th/ 347
METRIC RANK
24.5%
SINGLE MOTHER POVERTY
100.0/ 100
METRIC RATING
6th/ 347
METRIC RANK
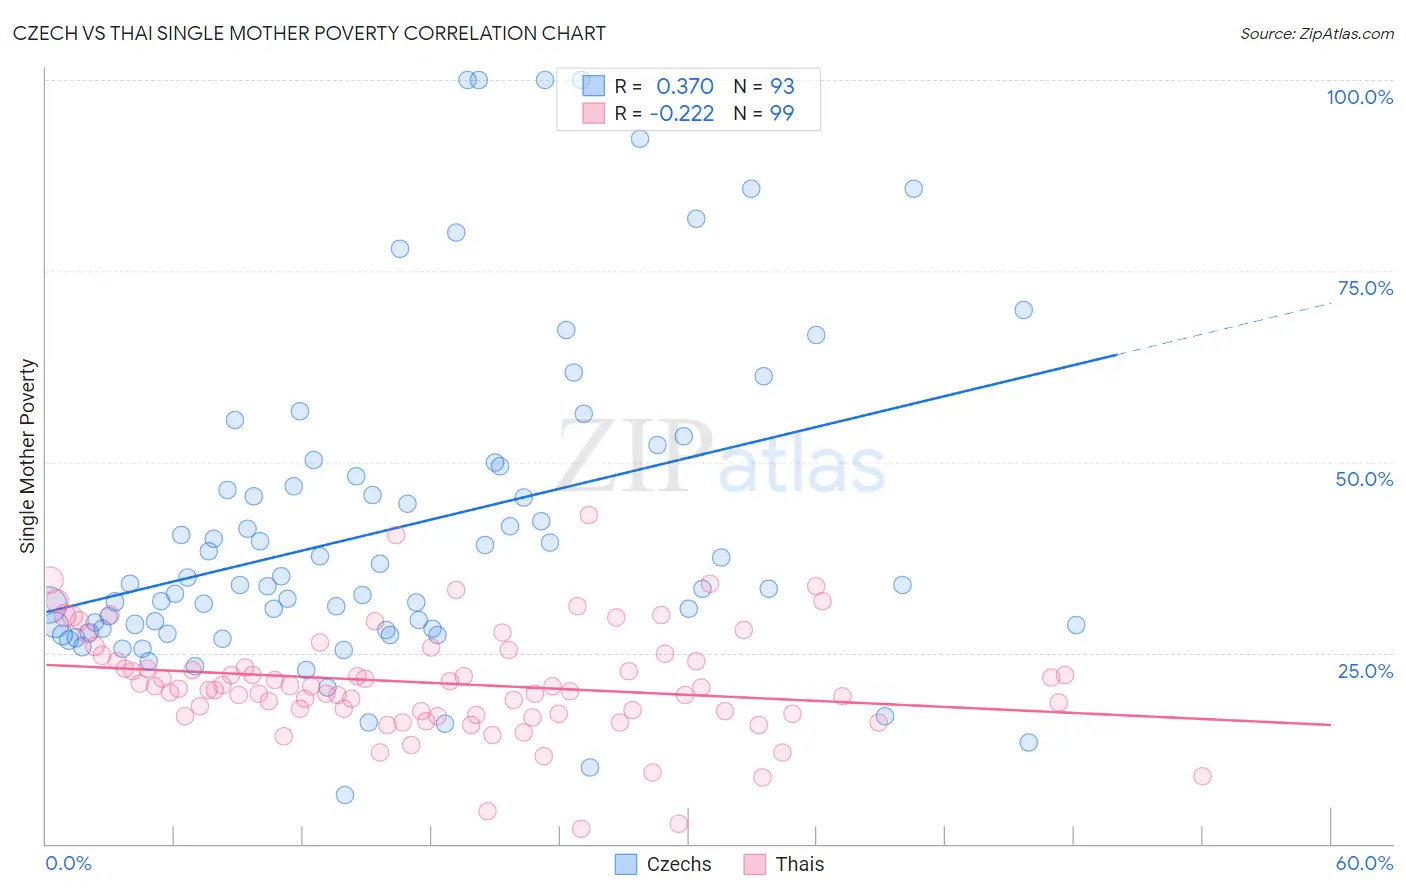
Czech vs Thai Single Mother Poverty Correlation Chart
The statistical analysis conducted on geographies consisting of 466,588,307 people shows a mild positive correlation between the proportion of Czechs and poverty level among single mothers in the United States with a correlation coefficient (R) of 0.370 and weighted average of 28.9%. Similarly, the statistical analysis conducted on geographies consisting of 460,866,767 people shows a weak negative correlation between the proportion of Thais and poverty level among single mothers in the United States with a correlation coefficient (R) of -0.222 and weighted average of 24.5%, a difference of 18.0%.
Single Mother Poverty Correlation Summary
| Measurement | Czech | Thai |
| Minimum | 6.4% | 2.0% |
| Maximum | 100.0% | 43.0% |
| Range | 93.6% | 41.0% |
| Mean | 41.3% | 21.0% |
| Median | 33.8% | 20.5% |
| Interquartile 25% (IQ1) | 28.1% | 17.1% |
| Interquartile 75% (IQ3) | 48.7% | 24.6% |
| Interquartile Range (IQR) | 20.7% | 7.6% |
| Standard Deviation (Sample) | 21.1% | 7.1% |
| Standard Deviation (Population) | 21.0% | 7.1% |
Similar Demographics by Single Mother Poverty
Demographics Similar to Czechs by Single Mother Poverty
In terms of single mother poverty, the demographic groups most similar to Czechs are Japanese (28.9%, a difference of 0.020%), Immigrants from Cambodia (28.9%, a difference of 0.10%), Immigrants from Hungary (28.9%, a difference of 0.12%), Scandinavian (28.9%, a difference of 0.12%), and Immigrants from Nigeria (28.9%, a difference of 0.14%).
| Demographics | Rating | Rank | Single Mother Poverty |
| Austrians | 79.0 /100 | #152 | Good 28.7% |
| Slovenes | 76.4 /100 | #153 | Good 28.8% |
| Portuguese | 73.2 /100 | #154 | Good 28.8% |
| Ugandans | 71.7 /100 | #155 | Good 28.8% |
| Iraqis | 71.5 /100 | #156 | Good 28.8% |
| Immigrants | Western Europe | 71.1 /100 | #157 | Good 28.9% |
| Immigrants | Hungary | 70.6 /100 | #158 | Good 28.9% |
| Czechs | 68.4 /100 | #159 | Good 28.9% |
| Japanese | 68.0 /100 | #160 | Good 28.9% |
| Immigrants | Cambodia | 66.6 /100 | #161 | Good 28.9% |
| Scandinavians | 66.2 /100 | #162 | Good 28.9% |
| Immigrants | Nigeria | 65.9 /100 | #163 | Good 28.9% |
| Immigrants | Kenya | 65.9 /100 | #164 | Good 28.9% |
| Arabs | 60.7 /100 | #165 | Good 29.0% |
| Inupiat | 60.4 /100 | #166 | Good 29.0% |
Demographics Similar to Thais by Single Mother Poverty
In terms of single mother poverty, the demographic groups most similar to Thais are Immigrants from Hong Kong (24.4%, a difference of 0.49%), Chinese (24.6%, a difference of 0.54%), Filipino (24.3%, a difference of 0.72%), Immigrants from Iran (25.1%, a difference of 2.5%), and Immigrants from Taiwan (23.9%, a difference of 2.7%).
| Demographics | Rating | Rank | Single Mother Poverty |
| Assyrians/Chaldeans/Syriacs | 100.0 /100 | #1 | Exceptional 23.8% |
| Immigrants | India | 100.0 /100 | #2 | Exceptional 23.8% |
| Immigrants | Taiwan | 100.0 /100 | #3 | Exceptional 23.9% |
| Filipinos | 100.0 /100 | #4 | Exceptional 24.3% |
| Immigrants | Hong Kong | 100.0 /100 | #5 | Exceptional 24.4% |
| Thais | 100.0 /100 | #6 | Exceptional 24.5% |
| Chinese | 100.0 /100 | #7 | Exceptional 24.6% |
| Immigrants | Iran | 100.0 /100 | #8 | Exceptional 25.1% |
| Immigrants | Lithuania | 100.0 /100 | #9 | Exceptional 25.2% |
| Immigrants | South Central Asia | 100.0 /100 | #10 | Exceptional 25.3% |
| Iranians | 100.0 /100 | #11 | Exceptional 25.5% |
| Bhutanese | 100.0 /100 | #12 | Exceptional 25.6% |
| Indians (Asian) | 100.0 /100 | #13 | Exceptional 25.8% |
| Immigrants | Singapore | 100.0 /100 | #14 | Exceptional 25.8% |
| Immigrants | Ireland | 100.0 /100 | #15 | Exceptional 25.8% |