Greek vs Immigrants from Latvia Child Poverty Under the Age of 5
COMPARE
Greek
Immigrants from Latvia
Child Poverty Under the Age of 5
Child Poverty Under the Age of 5 Comparison
Greeks
Immigrants from Latvia
15.2%
CHILD POVERTY UNDER THE AGE OF 5
99.0/ 100
METRIC RATING
67th/ 347
METRIC RANK
15.6%
CHILD POVERTY UNDER THE AGE OF 5
97.4/ 100
METRIC RATING
85th/ 347
METRIC RANK
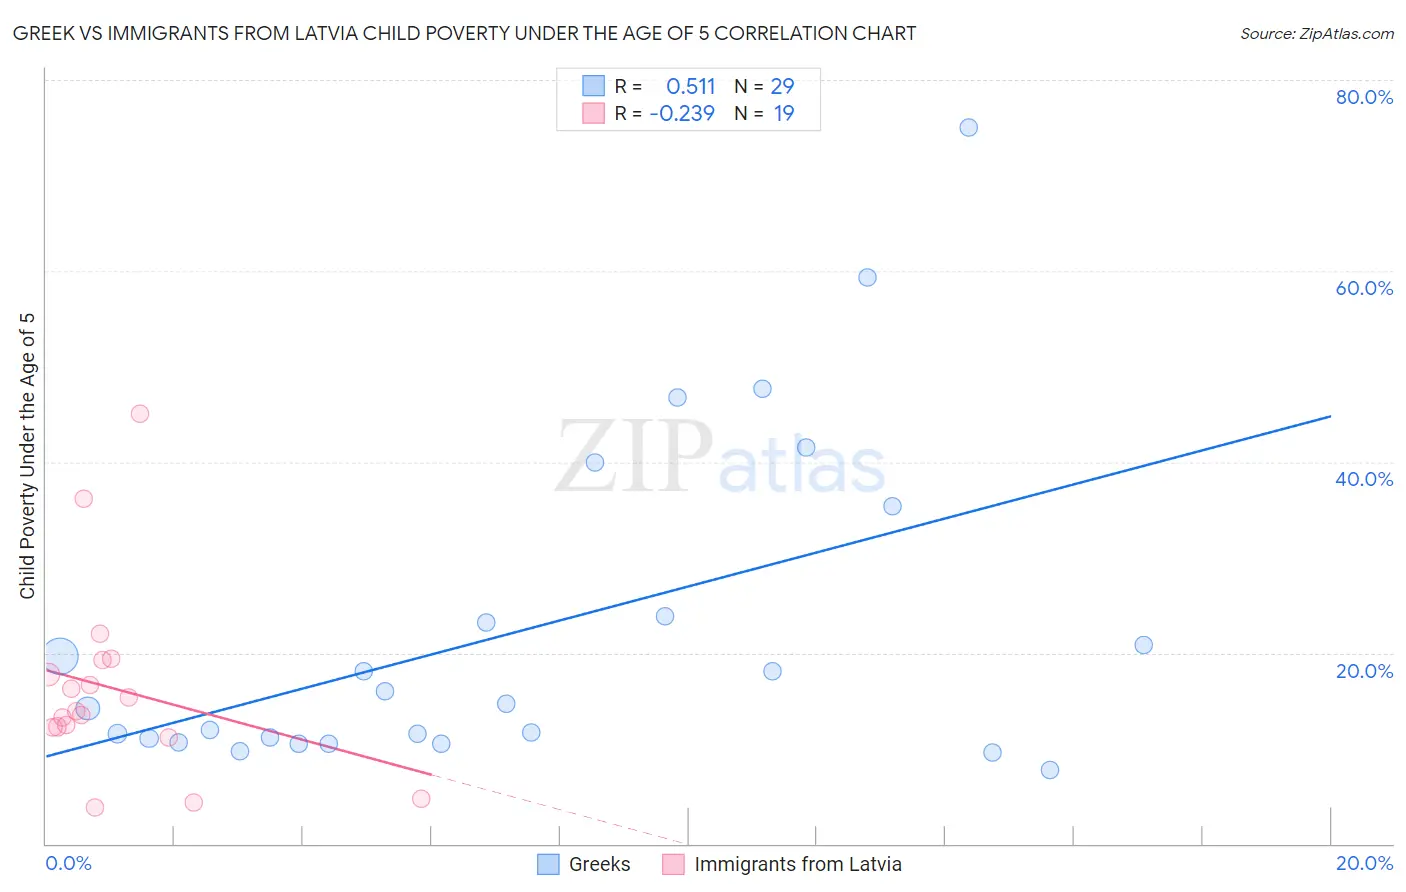
Greek vs Immigrants from Latvia Child Poverty Under the Age of 5 Correlation Chart
The statistical analysis conducted on geographies consisting of 455,265,275 people shows a substantial positive correlation between the proportion of Greeks and poverty level among children under the age of 5 in the United States with a correlation coefficient (R) of 0.511 and weighted average of 15.2%. Similarly, the statistical analysis conducted on geographies consisting of 111,248,278 people shows a weak negative correlation between the proportion of Immigrants from Latvia and poverty level among children under the age of 5 in the United States with a correlation coefficient (R) of -0.239 and weighted average of 15.6%, a difference of 2.8%.
Child Poverty Under the Age of 5 Correlation Summary
| Measurement | Greek | Immigrants from Latvia |
| Minimum | 7.8% | 3.8% |
| Maximum | 75.0% | 45.0% |
| Range | 67.2% | 41.2% |
| Mean | 22.5% | 16.3% |
| Median | 14.7% | 13.8% |
| Interquartile 25% (IQ1) | 10.8% | 12.2% |
| Interquartile 75% (IQ3) | 29.5% | 19.3% |
| Interquartile Range (IQR) | 18.8% | 7.1% |
| Standard Deviation (Sample) | 17.2% | 10.0% |
| Standard Deviation (Population) | 16.9% | 9.7% |
Demographics Similar to Greeks and Immigrants from Latvia by Child Poverty Under the Age of 5
In terms of child poverty under the age of 5, the demographic groups most similar to Greeks are Zimbabwean (15.2%, a difference of 0.0%), Lithuanian (15.2%, a difference of 0.020%), Immigrants from Scotland (15.2%, a difference of 0.060%), Immigrants from Belgium (15.3%, a difference of 0.45%), and Immigrants from Egypt (15.3%, a difference of 0.45%). Similarly, the demographic groups most similar to Immigrants from Latvia are Immigrants from Malaysia (15.6%, a difference of 0.0%), Immigrants from Netherlands (15.6%, a difference of 0.16%), Chilean (15.6%, a difference of 0.18%), Immigrants from Italy (15.6%, a difference of 0.34%), and Czech (15.5%, a difference of 0.48%).
| Demographics | Rating | Rank | Child Poverty Under the Age of 5 |
| Immigrants | Scotland | 99.0 /100 | #66 | Exceptional 15.2% |
| Greeks | 99.0 /100 | #67 | Exceptional 15.2% |
| Zimbabweans | 99.0 /100 | #68 | Exceptional 15.2% |
| Lithuanians | 99.0 /100 | #69 | Exceptional 15.2% |
| Immigrants | Belgium | 98.8 /100 | #70 | Exceptional 15.3% |
| Immigrants | Egypt | 98.8 /100 | #71 | Exceptional 15.3% |
| Immigrants | Sweden | 98.8 /100 | #72 | Exceptional 15.3% |
| Immigrants | Ukraine | 98.7 /100 | #73 | Exceptional 15.3% |
| Argentineans | 98.5 /100 | #74 | Exceptional 15.4% |
| Immigrants | Argentina | 98.5 /100 | #75 | Exceptional 15.4% |
| Croatians | 98.5 /100 | #76 | Exceptional 15.4% |
| Immigrants | Turkey | 98.3 /100 | #77 | Exceptional 15.4% |
| Sri Lankans | 98.1 /100 | #78 | Exceptional 15.5% |
| Australians | 98.0 /100 | #79 | Exceptional 15.5% |
| Italians | 97.9 /100 | #80 | Exceptional 15.5% |
| Czechs | 97.8 /100 | #81 | Exceptional 15.5% |
| Immigrants | Italy | 97.7 /100 | #82 | Exceptional 15.6% |
| Chileans | 97.6 /100 | #83 | Exceptional 15.6% |
| Immigrants | Netherlands | 97.6 /100 | #84 | Exceptional 15.6% |
| Immigrants | Latvia | 97.4 /100 | #85 | Exceptional 15.6% |
| Immigrants | Malaysia | 97.4 /100 | #86 | Exceptional 15.6% |