Cuban vs Colombian Child Poverty Under the Age of 5
COMPARE
Cuban
Colombian
Child Poverty Under the Age of 5
Child Poverty Under the Age of 5 Comparison
Cubans
Colombians
19.1%
CHILD POVERTY UNDER THE AGE OF 5
1.7/ 100
METRIC RATING
223rd/ 347
METRIC RANK
16.7%
CHILD POVERTY UNDER THE AGE OF 5
77.8/ 100
METRIC RATING
150th/ 347
METRIC RANK
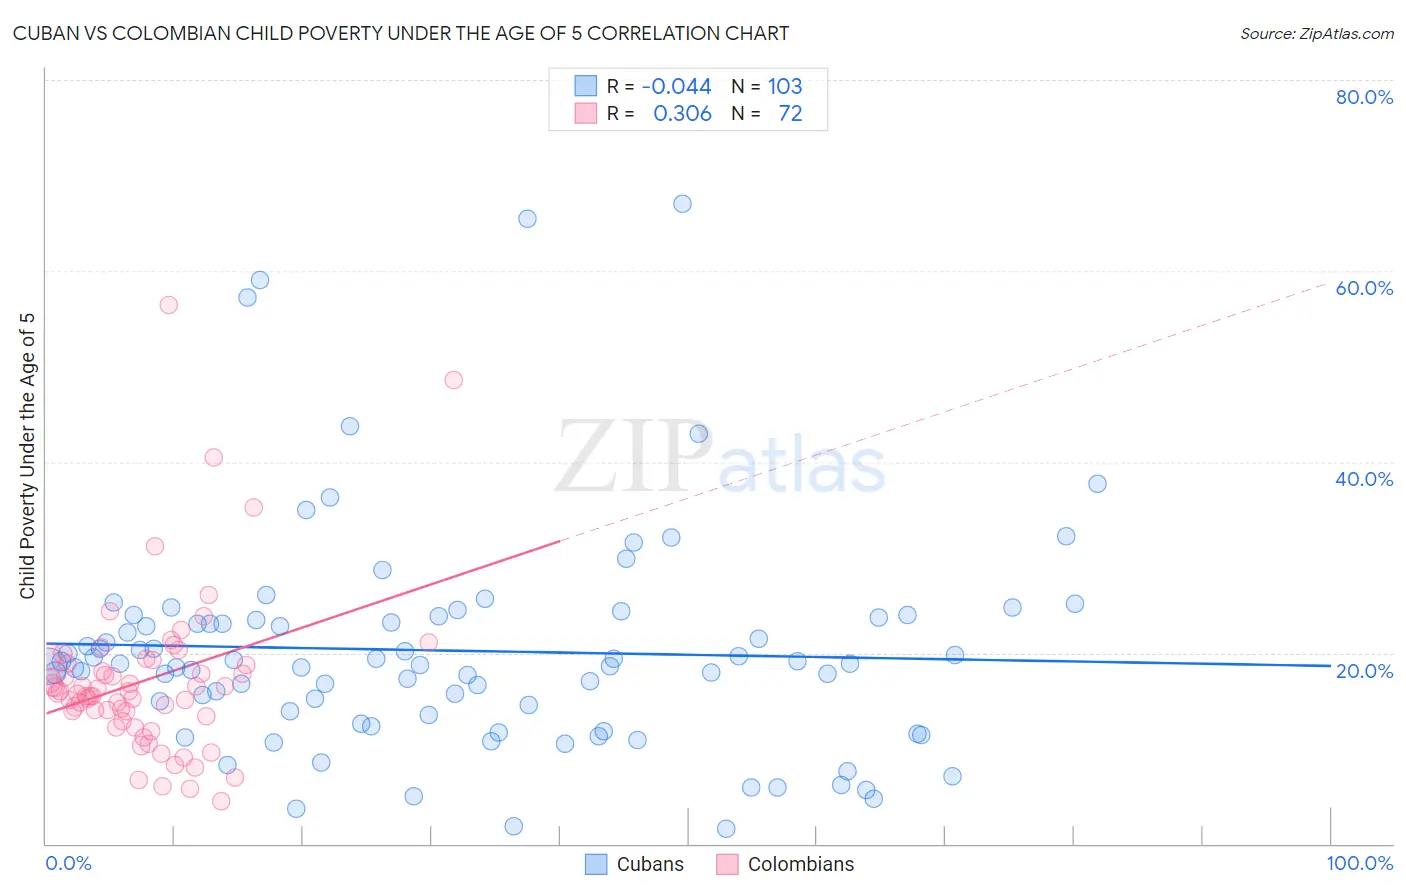
Cuban vs Colombian Child Poverty Under the Age of 5 Correlation Chart
The statistical analysis conducted on geographies consisting of 429,948,450 people shows no correlation between the proportion of Cubans and poverty level among children under the age of 5 in the United States with a correlation coefficient (R) of -0.044 and weighted average of 19.1%. Similarly, the statistical analysis conducted on geographies consisting of 402,400,688 people shows a mild positive correlation between the proportion of Colombians and poverty level among children under the age of 5 in the United States with a correlation coefficient (R) of 0.306 and weighted average of 16.7%, a difference of 14.3%.
Child Poverty Under the Age of 5 Correlation Summary
| Measurement | Cuban | Colombian |
| Minimum | 1.6% | 4.4% |
| Maximum | 67.1% | 56.5% |
| Range | 65.5% | 52.0% |
| Mean | 20.2% | 17.1% |
| Median | 18.8% | 15.9% |
| Interquartile 25% (IQ1) | 13.5% | 13.6% |
| Interquartile 75% (IQ3) | 23.6% | 19.1% |
| Interquartile Range (IQR) | 10.1% | 5.4% |
| Standard Deviation (Sample) | 11.7% | 8.6% |
| Standard Deviation (Population) | 11.7% | 8.5% |
Similar Demographics by Child Poverty Under the Age of 5
Demographics Similar to Cubans by Child Poverty Under the Age of 5
In terms of child poverty under the age of 5, the demographic groups most similar to Cubans are Alsatian (19.1%, a difference of 0.020%), Nicaraguan (19.1%, a difference of 0.11%), Nigerian (19.1%, a difference of 0.14%), Immigrants from Eritrea (19.1%, a difference of 0.16%), and Cape Verdean (19.1%, a difference of 0.34%).
| Demographics | Rating | Rank | Child Poverty Under the Age of 5 |
| Hmong | 5.0 /100 | #216 | Tragic 18.5% |
| Immigrants | Africa | 4.6 /100 | #217 | Tragic 18.6% |
| Delaware | 3.4 /100 | #218 | Tragic 18.7% |
| German Russians | 3.0 /100 | #219 | Tragic 18.8% |
| Immigrants | Azores | 2.6 /100 | #220 | Tragic 18.9% |
| Immigrants | Nigeria | 2.1 /100 | #221 | Tragic 19.0% |
| Alsatians | 1.7 /100 | #222 | Tragic 19.1% |
| Cubans | 1.7 /100 | #223 | Tragic 19.1% |
| Nicaraguans | 1.6 /100 | #224 | Tragic 19.1% |
| Nigerians | 1.6 /100 | #225 | Tragic 19.1% |
| Immigrants | Eritrea | 1.5 /100 | #226 | Tragic 19.1% |
| Cape Verdeans | 1.4 /100 | #227 | Tragic 19.1% |
| Immigrants | Sudan | 1.3 /100 | #228 | Tragic 19.2% |
| Ghanaians | 1.2 /100 | #229 | Tragic 19.2% |
| Ecuadorians | 1.2 /100 | #230 | Tragic 19.2% |
Demographics Similar to Colombians by Child Poverty Under the Age of 5
In terms of child poverty under the age of 5, the demographic groups most similar to Colombians are Canadian (16.7%, a difference of 0.030%), Belgian (16.7%, a difference of 0.10%), Dutch (16.7%, a difference of 0.11%), New Zealander (16.6%, a difference of 0.14%), and Syrian (16.6%, a difference of 0.20%).
| Demographics | Rating | Rank | Child Poverty Under the Age of 5 |
| Samoans | 83.0 /100 | #143 | Excellent 16.5% |
| Ethiopians | 82.7 /100 | #144 | Excellent 16.5% |
| Immigrants | Ethiopia | 82.1 /100 | #145 | Excellent 16.6% |
| Israelis | 82.0 /100 | #146 | Excellent 16.6% |
| Immigrants | Nepal | 80.3 /100 | #147 | Excellent 16.6% |
| Syrians | 79.1 /100 | #148 | Good 16.6% |
| New Zealanders | 78.7 /100 | #149 | Good 16.6% |
| Colombians | 77.8 /100 | #150 | Good 16.7% |
| Canadians | 77.6 /100 | #151 | Good 16.7% |
| Belgians | 77.2 /100 | #152 | Good 16.7% |
| Dutch | 77.1 /100 | #153 | Good 16.7% |
| Immigrants | Venezuela | 76.0 /100 | #154 | Good 16.7% |
| South Americans | 75.1 /100 | #155 | Good 16.7% |
| Afghans | 74.4 /100 | #156 | Good 16.8% |
| Venezuelans | 73.7 /100 | #157 | Good 16.8% |