Asian vs Immigrants from Latvia Child Poverty Under the Age of 5
COMPARE
Asian
Immigrants from Latvia
Child Poverty Under the Age of 5
Child Poverty Under the Age of 5 Comparison
Asians
Immigrants from Latvia
14.0%
CHILD POVERTY UNDER THE AGE OF 5
99.9/ 100
METRIC RATING
24th/ 347
METRIC RANK
15.6%
CHILD POVERTY UNDER THE AGE OF 5
97.4/ 100
METRIC RATING
85th/ 347
METRIC RANK
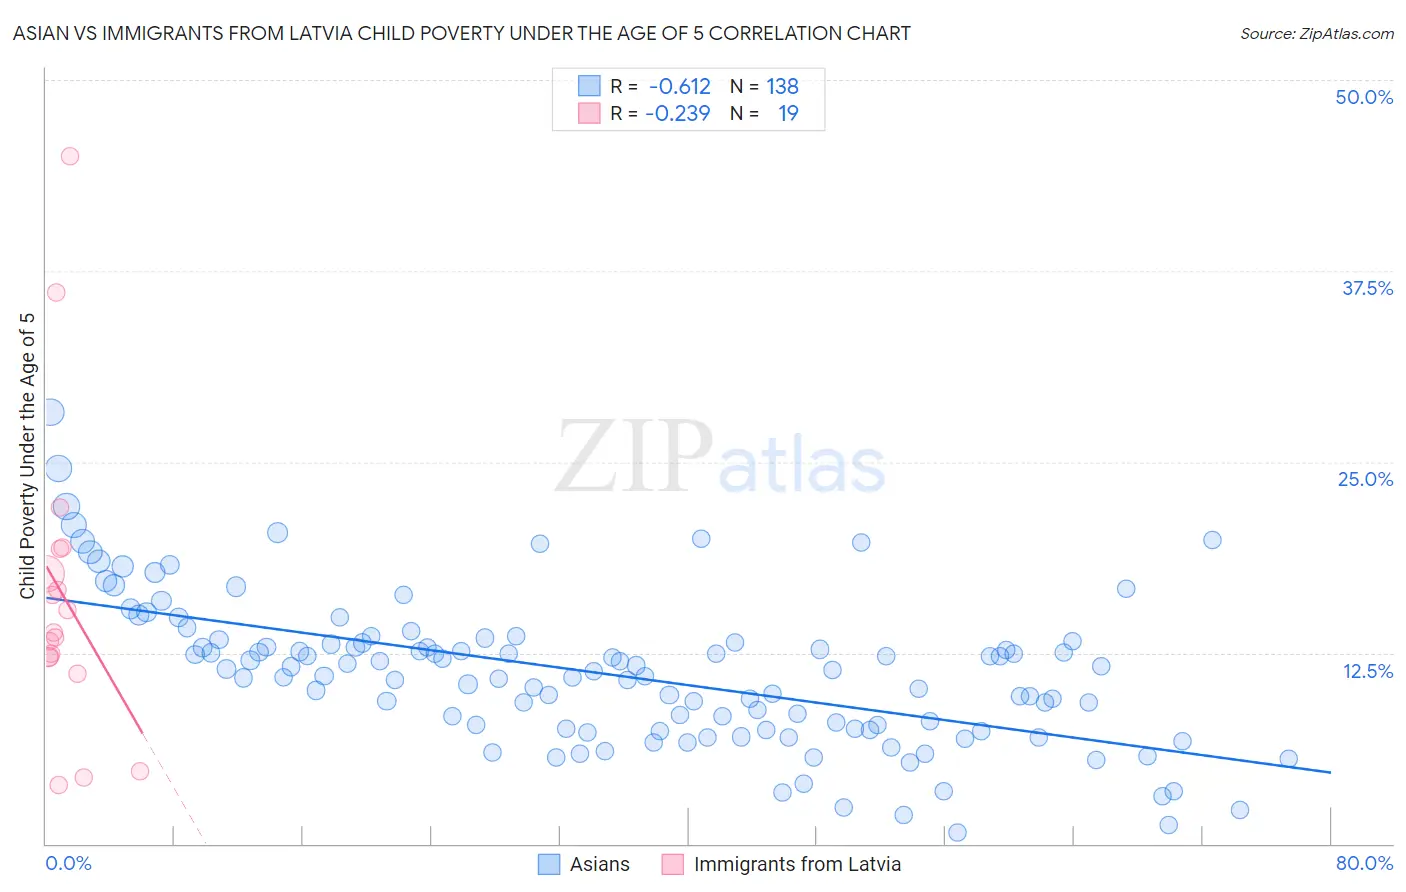
Asian vs Immigrants from Latvia Child Poverty Under the Age of 5 Correlation Chart
The statistical analysis conducted on geographies consisting of 515,784,088 people shows a significant negative correlation between the proportion of Asians and poverty level among children under the age of 5 in the United States with a correlation coefficient (R) of -0.612 and weighted average of 14.0%. Similarly, the statistical analysis conducted on geographies consisting of 111,248,278 people shows a weak negative correlation between the proportion of Immigrants from Latvia and poverty level among children under the age of 5 in the United States with a correlation coefficient (R) of -0.239 and weighted average of 15.6%, a difference of 11.7%.
Child Poverty Under the Age of 5 Correlation Summary
| Measurement | Asian | Immigrants from Latvia |
| Minimum | 0.77% | 3.8% |
| Maximum | 28.3% | 45.0% |
| Range | 27.5% | 41.2% |
| Mean | 11.1% | 16.3% |
| Median | 11.1% | 13.8% |
| Interquartile 25% (IQ1) | 7.6% | 12.2% |
| Interquartile 75% (IQ3) | 13.2% | 19.3% |
| Interquartile Range (IQR) | 5.6% | 7.1% |
| Standard Deviation (Sample) | 4.8% | 10.0% |
| Standard Deviation (Population) | 4.8% | 9.7% |
Similar Demographics by Child Poverty Under the Age of 5
Demographics Similar to Asians by Child Poverty Under the Age of 5
In terms of child poverty under the age of 5, the demographic groups most similar to Asians are Cypriot (14.0%, a difference of 0.0%), Bulgarian (13.9%, a difference of 0.51%), Immigrants from Lithuania (14.1%, a difference of 0.93%), Immigrants from Bolivia (13.8%, a difference of 0.96%), and Bolivian (13.8%, a difference of 1.0%).
| Demographics | Rating | Rank | Child Poverty Under the Age of 5 |
| Assyrians/Chaldeans/Syriacs | 100.0 /100 | #17 | Exceptional 13.6% |
| Immigrants | China | 100.0 /100 | #18 | Exceptional 13.6% |
| Immigrants | Ireland | 100.0 /100 | #19 | Exceptional 13.7% |
| Immigrants | Japan | 100.0 /100 | #20 | Exceptional 13.8% |
| Bolivians | 100.0 /100 | #21 | Exceptional 13.8% |
| Immigrants | Bolivia | 100.0 /100 | #22 | Exceptional 13.8% |
| Bulgarians | 99.9 /100 | #23 | Exceptional 13.9% |
| Asians | 99.9 /100 | #24 | Exceptional 14.0% |
| Cypriots | 99.9 /100 | #25 | Exceptional 14.0% |
| Immigrants | Lithuania | 99.9 /100 | #26 | Exceptional 14.1% |
| Tongans | 99.9 /100 | #27 | Exceptional 14.2% |
| Immigrants | Indonesia | 99.8 /100 | #28 | Exceptional 14.3% |
| Immigrants | Asia | 99.8 /100 | #29 | Exceptional 14.4% |
| Cambodians | 99.8 /100 | #30 | Exceptional 14.4% |
| Koreans | 99.8 /100 | #31 | Exceptional 14.4% |
Demographics Similar to Immigrants from Latvia by Child Poverty Under the Age of 5
In terms of child poverty under the age of 5, the demographic groups most similar to Immigrants from Latvia are Immigrants from Malaysia (15.6%, a difference of 0.0%), Immigrants from Vietnam (15.6%, a difference of 0.080%), Jordanian (15.6%, a difference of 0.14%), Immigrants from Netherlands (15.6%, a difference of 0.16%), and Chilean (15.6%, a difference of 0.18%).
| Demographics | Rating | Rank | Child Poverty Under the Age of 5 |
| Sri Lankans | 98.1 /100 | #78 | Exceptional 15.5% |
| Australians | 98.0 /100 | #79 | Exceptional 15.5% |
| Italians | 97.9 /100 | #80 | Exceptional 15.5% |
| Czechs | 97.8 /100 | #81 | Exceptional 15.5% |
| Immigrants | Italy | 97.7 /100 | #82 | Exceptional 15.6% |
| Chileans | 97.6 /100 | #83 | Exceptional 15.6% |
| Immigrants | Netherlands | 97.6 /100 | #84 | Exceptional 15.6% |
| Immigrants | Latvia | 97.4 /100 | #85 | Exceptional 15.6% |
| Immigrants | Malaysia | 97.4 /100 | #86 | Exceptional 15.6% |
| Immigrants | Vietnam | 97.4 /100 | #87 | Exceptional 15.6% |
| Jordanians | 97.3 /100 | #88 | Exceptional 15.6% |
| Immigrants | Croatia | 97.3 /100 | #89 | Exceptional 15.6% |
| Immigrants | France | 97.3 /100 | #90 | Exceptional 15.6% |
| Poles | 97.2 /100 | #91 | Exceptional 15.7% |
| Scandinavians | 97.1 /100 | #92 | Exceptional 15.7% |