Pennsylvania German vs Immigrants from Latvia Child Poverty Under the Age of 5
COMPARE
Pennsylvania German
Immigrants from Latvia
Child Poverty Under the Age of 5
Child Poverty Under the Age of 5 Comparison
Pennsylvania Germans
Immigrants from Latvia
19.8%
CHILD POVERTY UNDER THE AGE OF 5
0.3/ 100
METRIC RATING
251st/ 347
METRIC RANK
15.6%
CHILD POVERTY UNDER THE AGE OF 5
97.4/ 100
METRIC RATING
85th/ 347
METRIC RANK
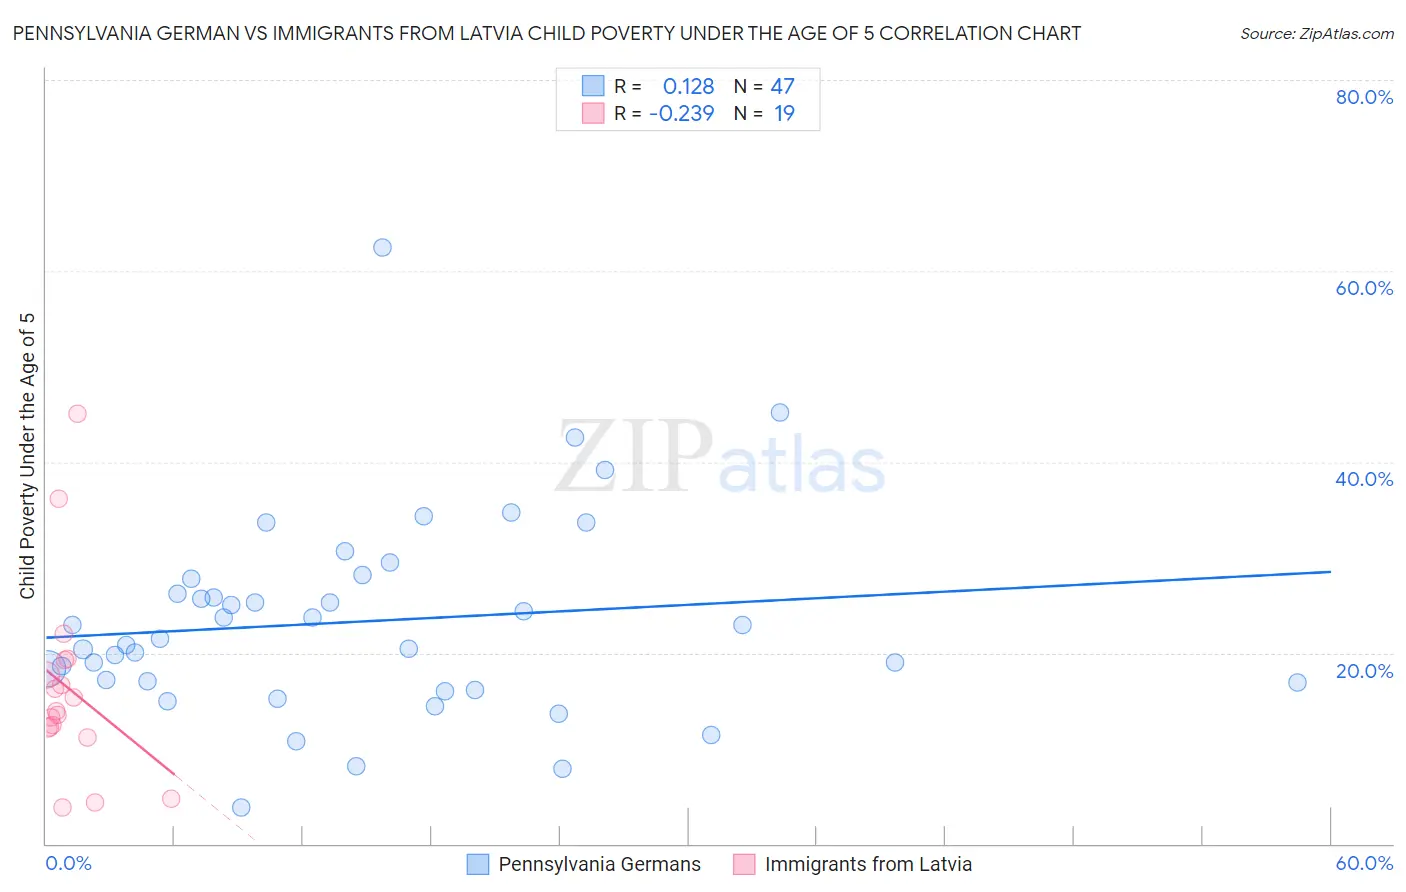
Pennsylvania German vs Immigrants from Latvia Child Poverty Under the Age of 5 Correlation Chart
The statistical analysis conducted on geographies consisting of 226,788,326 people shows a poor positive correlation between the proportion of Pennsylvania Germans and poverty level among children under the age of 5 in the United States with a correlation coefficient (R) of 0.128 and weighted average of 19.8%. Similarly, the statistical analysis conducted on geographies consisting of 111,248,278 people shows a weak negative correlation between the proportion of Immigrants from Latvia and poverty level among children under the age of 5 in the United States with a correlation coefficient (R) of -0.239 and weighted average of 15.6%, a difference of 26.7%.
Child Poverty Under the Age of 5 Correlation Summary
| Measurement | Pennsylvania German | Immigrants from Latvia |
| Minimum | 3.8% | 3.8% |
| Maximum | 62.5% | 45.0% |
| Range | 58.7% | 41.2% |
| Mean | 23.3% | 16.3% |
| Median | 21.4% | 13.8% |
| Interquartile 25% (IQ1) | 16.9% | 12.2% |
| Interquartile 75% (IQ3) | 27.8% | 19.3% |
| Interquartile Range (IQR) | 10.9% | 7.1% |
| Standard Deviation (Sample) | 10.5% | 10.0% |
| Standard Deviation (Population) | 10.4% | 9.7% |
Similar Demographics by Child Poverty Under the Age of 5
Demographics Similar to Pennsylvania Germans by Child Poverty Under the Age of 5
In terms of child poverty under the age of 5, the demographic groups most similar to Pennsylvania Germans are Immigrants from Nicaragua (19.8%, a difference of 0.040%), Nonimmigrants (19.7%, a difference of 0.17%), Immigrants from Middle Africa (19.7%, a difference of 0.22%), Marshallese (19.7%, a difference of 0.24%), and Guyanese (19.7%, a difference of 0.26%).
| Demographics | Rating | Rank | Child Poverty Under the Age of 5 |
| Immigrants | Ghana | 0.5 /100 | #244 | Tragic 19.6% |
| Immigrants | Western Africa | 0.4 /100 | #245 | Tragic 19.7% |
| Cree | 0.4 /100 | #246 | Tragic 19.7% |
| Guyanese | 0.4 /100 | #247 | Tragic 19.7% |
| Marshallese | 0.4 /100 | #248 | Tragic 19.7% |
| Immigrants | Middle Africa | 0.4 /100 | #249 | Tragic 19.7% |
| Immigrants | Nonimmigrants | 0.4 /100 | #250 | Tragic 19.7% |
| Pennsylvania Germans | 0.3 /100 | #251 | Tragic 19.8% |
| Immigrants | Nicaragua | 0.3 /100 | #252 | Tragic 19.8% |
| Mexican American Indians | 0.3 /100 | #253 | Tragic 19.9% |
| Fijians | 0.3 /100 | #254 | Tragic 19.9% |
| Immigrants | Cuba | 0.2 /100 | #255 | Tragic 19.9% |
| Immigrants | Barbados | 0.2 /100 | #256 | Tragic 20.0% |
| Shoshone | 0.2 /100 | #257 | Tragic 20.0% |
| Immigrants | St. Vincent and the Grenadines | 0.2 /100 | #258 | Tragic 20.0% |
Demographics Similar to Immigrants from Latvia by Child Poverty Under the Age of 5
In terms of child poverty under the age of 5, the demographic groups most similar to Immigrants from Latvia are Immigrants from Malaysia (15.6%, a difference of 0.0%), Immigrants from Vietnam (15.6%, a difference of 0.080%), Jordanian (15.6%, a difference of 0.14%), Immigrants from Netherlands (15.6%, a difference of 0.16%), and Chilean (15.6%, a difference of 0.18%).
| Demographics | Rating | Rank | Child Poverty Under the Age of 5 |
| Sri Lankans | 98.1 /100 | #78 | Exceptional 15.5% |
| Australians | 98.0 /100 | #79 | Exceptional 15.5% |
| Italians | 97.9 /100 | #80 | Exceptional 15.5% |
| Czechs | 97.8 /100 | #81 | Exceptional 15.5% |
| Immigrants | Italy | 97.7 /100 | #82 | Exceptional 15.6% |
| Chileans | 97.6 /100 | #83 | Exceptional 15.6% |
| Immigrants | Netherlands | 97.6 /100 | #84 | Exceptional 15.6% |
| Immigrants | Latvia | 97.4 /100 | #85 | Exceptional 15.6% |
| Immigrants | Malaysia | 97.4 /100 | #86 | Exceptional 15.6% |
| Immigrants | Vietnam | 97.4 /100 | #87 | Exceptional 15.6% |
| Jordanians | 97.3 /100 | #88 | Exceptional 15.6% |
| Immigrants | Croatia | 97.3 /100 | #89 | Exceptional 15.6% |
| Immigrants | France | 97.3 /100 | #90 | Exceptional 15.6% |
| Poles | 97.2 /100 | #91 | Exceptional 15.7% |
| Scandinavians | 97.1 /100 | #92 | Exceptional 15.7% |