Immigrants from Bosnia and Herzegovina vs Immigrants from Latvia Child Poverty Under the Age of 5
COMPARE
Immigrants from Bosnia and Herzegovina
Immigrants from Latvia
Child Poverty Under the Age of 5
Child Poverty Under the Age of 5 Comparison
Immigrants from Bosnia and Herzegovina
Immigrants from Latvia
17.5%
CHILD POVERTY UNDER THE AGE OF 5
35.0/ 100
METRIC RATING
186th/ 347
METRIC RANK
15.6%
CHILD POVERTY UNDER THE AGE OF 5
97.4/ 100
METRIC RATING
85th/ 347
METRIC RANK
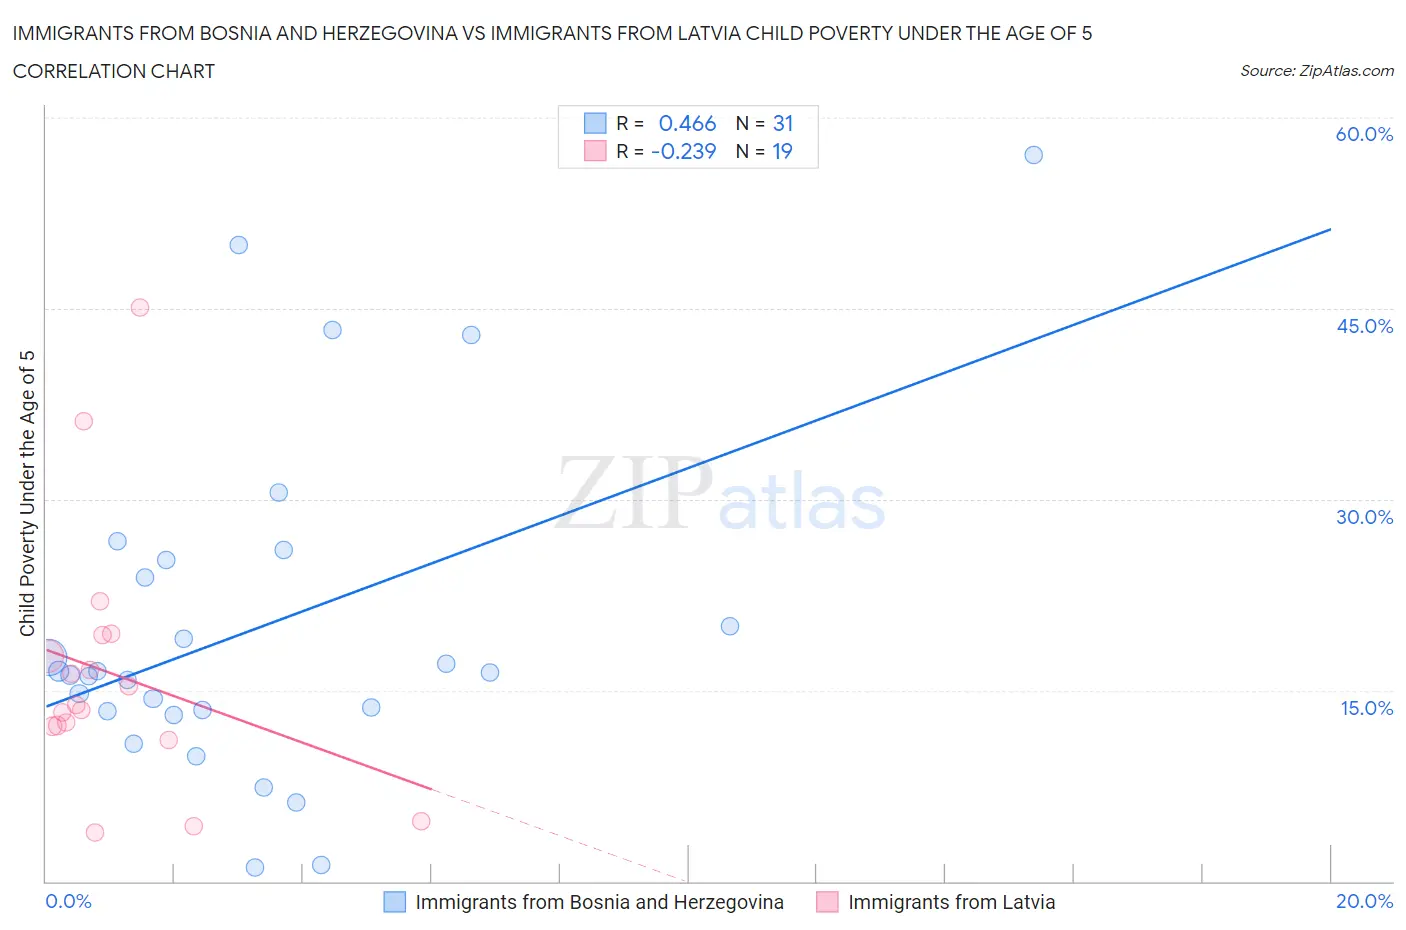
Immigrants from Bosnia and Herzegovina vs Immigrants from Latvia Child Poverty Under the Age of 5 Correlation Chart
The statistical analysis conducted on geographies consisting of 153,805,679 people shows a moderate positive correlation between the proportion of Immigrants from Bosnia and Herzegovina and poverty level among children under the age of 5 in the United States with a correlation coefficient (R) of 0.466 and weighted average of 17.5%. Similarly, the statistical analysis conducted on geographies consisting of 111,248,278 people shows a weak negative correlation between the proportion of Immigrants from Latvia and poverty level among children under the age of 5 in the United States with a correlation coefficient (R) of -0.239 and weighted average of 15.6%, a difference of 12.2%.
Child Poverty Under the Age of 5 Correlation Summary
| Measurement | Immigrants from Bosnia and Herzegovina | Immigrants from Latvia |
| Minimum | 1.0% | 3.8% |
| Maximum | 57.0% | 45.0% |
| Range | 56.0% | 41.2% |
| Mean | 19.9% | 16.3% |
| Median | 16.4% | 13.8% |
| Interquartile 25% (IQ1) | 13.3% | 12.2% |
| Interquartile 75% (IQ3) | 25.2% | 19.3% |
| Interquartile Range (IQR) | 11.9% | 7.1% |
| Standard Deviation (Sample) | 13.1% | 10.0% |
| Standard Deviation (Population) | 12.9% | 9.7% |
Similar Demographics by Child Poverty Under the Age of 5
Demographics Similar to Immigrants from Bosnia and Herzegovina by Child Poverty Under the Age of 5
In terms of child poverty under the age of 5, the demographic groups most similar to Immigrants from Bosnia and Herzegovina are Kenyan (17.5%, a difference of 0.040%), Carpatho Rusyn (17.5%, a difference of 0.16%), French (17.5%, a difference of 0.16%), Immigrants from Armenia (17.5%, a difference of 0.33%), and Immigrants from Costa Rica (17.4%, a difference of 0.45%).
| Demographics | Rating | Rank | Child Poverty Under the Age of 5 |
| Hawaiians | 41.5 /100 | #179 | Average 17.4% |
| South American Indians | 41.4 /100 | #180 | Average 17.4% |
| Immigrants | Germany | 41.0 /100 | #181 | Average 17.4% |
| Arabs | 40.7 /100 | #182 | Average 17.4% |
| Lebanese | 40.3 /100 | #183 | Average 17.4% |
| Immigrants | Costa Rica | 39.0 /100 | #184 | Fair 17.4% |
| Immigrants | Armenia | 38.0 /100 | #185 | Fair 17.5% |
| Immigrants | Bosnia and Herzegovina | 35.0 /100 | #186 | Fair 17.5% |
| Kenyans | 34.7 /100 | #187 | Fair 17.5% |
| Carpatho Rusyns | 33.6 /100 | #188 | Fair 17.5% |
| French | 33.6 /100 | #189 | Fair 17.5% |
| Slovaks | 29.2 /100 | #190 | Fair 17.6% |
| Immigrants | Afghanistan | 27.9 /100 | #191 | Fair 17.7% |
| Immigrants | Uruguay | 27.8 /100 | #192 | Fair 17.7% |
| Immigrants | Uganda | 25.0 /100 | #193 | Fair 17.7% |
Demographics Similar to Immigrants from Latvia by Child Poverty Under the Age of 5
In terms of child poverty under the age of 5, the demographic groups most similar to Immigrants from Latvia are Immigrants from Malaysia (15.6%, a difference of 0.0%), Immigrants from Vietnam (15.6%, a difference of 0.080%), Jordanian (15.6%, a difference of 0.14%), Immigrants from Netherlands (15.6%, a difference of 0.16%), and Chilean (15.6%, a difference of 0.18%).
| Demographics | Rating | Rank | Child Poverty Under the Age of 5 |
| Sri Lankans | 98.1 /100 | #78 | Exceptional 15.5% |
| Australians | 98.0 /100 | #79 | Exceptional 15.5% |
| Italians | 97.9 /100 | #80 | Exceptional 15.5% |
| Czechs | 97.8 /100 | #81 | Exceptional 15.5% |
| Immigrants | Italy | 97.7 /100 | #82 | Exceptional 15.6% |
| Chileans | 97.6 /100 | #83 | Exceptional 15.6% |
| Immigrants | Netherlands | 97.6 /100 | #84 | Exceptional 15.6% |
| Immigrants | Latvia | 97.4 /100 | #85 | Exceptional 15.6% |
| Immigrants | Malaysia | 97.4 /100 | #86 | Exceptional 15.6% |
| Immigrants | Vietnam | 97.4 /100 | #87 | Exceptional 15.6% |
| Jordanians | 97.3 /100 | #88 | Exceptional 15.6% |
| Immigrants | Croatia | 97.3 /100 | #89 | Exceptional 15.6% |
| Immigrants | France | 97.3 /100 | #90 | Exceptional 15.6% |
| Poles | 97.2 /100 | #91 | Exceptional 15.7% |
| Scandinavians | 97.1 /100 | #92 | Exceptional 15.7% |