Cuban vs Irish Child Poverty Under the Age of 5
COMPARE
Cuban
Irish
Child Poverty Under the Age of 5
Child Poverty Under the Age of 5 Comparison
Cubans
Irish
19.1%
CHILD POVERTY UNDER THE AGE OF 5
1.7/ 100
METRIC RATING
223rd/ 347
METRIC RANK
16.8%
CHILD POVERTY UNDER THE AGE OF 5
72.0/ 100
METRIC RATING
160th/ 347
METRIC RANK
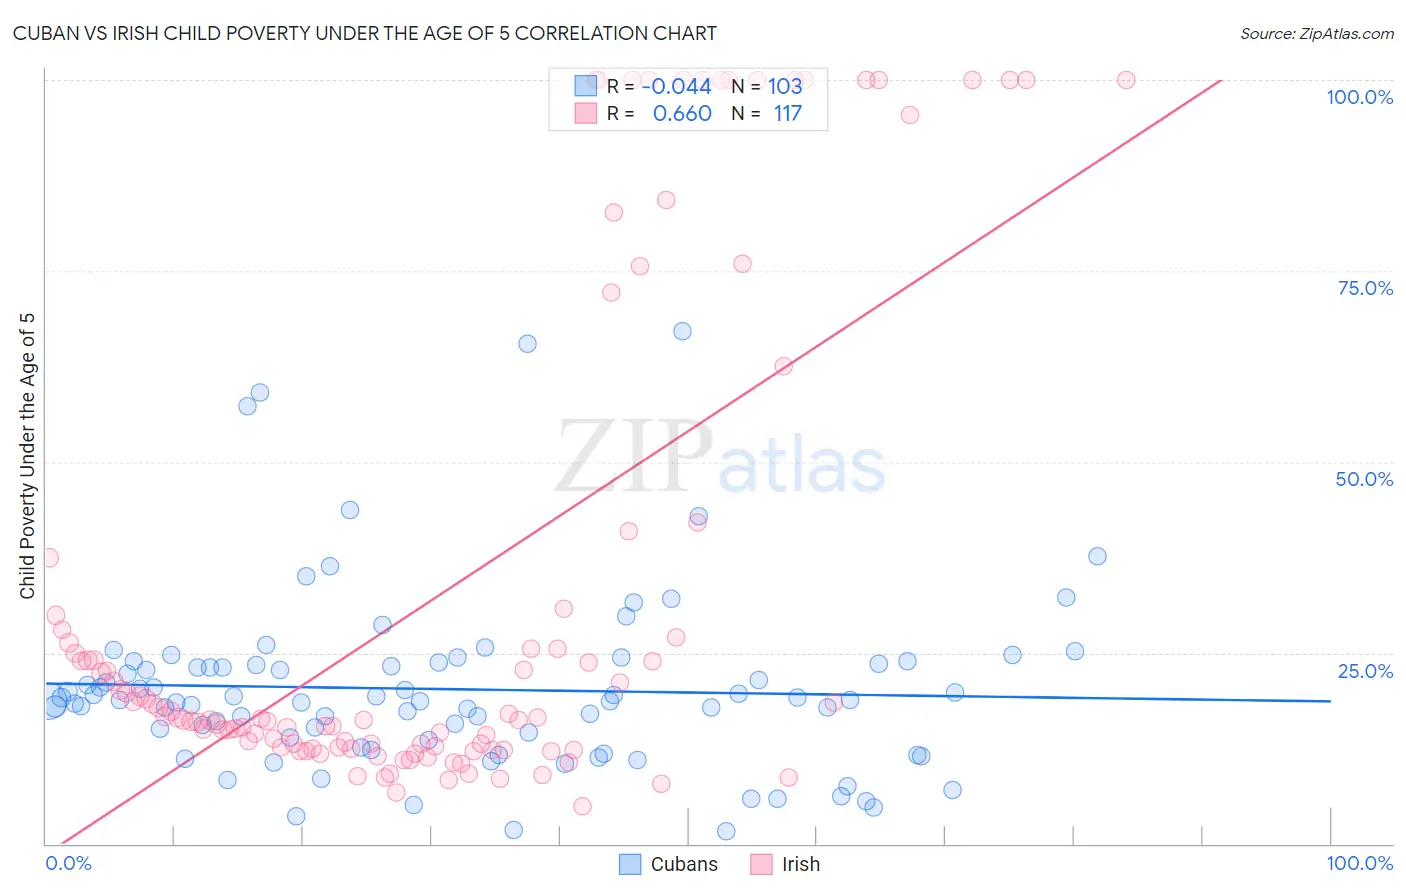
Cuban vs Irish Child Poverty Under the Age of 5 Correlation Chart
The statistical analysis conducted on geographies consisting of 429,948,450 people shows no correlation between the proportion of Cubans and poverty level among children under the age of 5 in the United States with a correlation coefficient (R) of -0.044 and weighted average of 19.1%. Similarly, the statistical analysis conducted on geographies consisting of 536,582,849 people shows a significant positive correlation between the proportion of Irish and poverty level among children under the age of 5 in the United States with a correlation coefficient (R) of 0.660 and weighted average of 16.8%, a difference of 13.4%.
Child Poverty Under the Age of 5 Correlation Summary
| Measurement | Cuban | Irish |
| Minimum | 1.6% | 4.9% |
| Maximum | 67.1% | 100.0% |
| Range | 65.5% | 95.1% |
| Mean | 20.2% | 32.4% |
| Median | 18.8% | 16.4% |
| Interquartile 25% (IQ1) | 13.5% | 12.5% |
| Interquartile 75% (IQ3) | 23.6% | 29.0% |
| Interquartile Range (IQR) | 10.1% | 16.5% |
| Standard Deviation (Sample) | 11.7% | 32.3% |
| Standard Deviation (Population) | 11.7% | 32.1% |
Similar Demographics by Child Poverty Under the Age of 5
Demographics Similar to Cubans by Child Poverty Under the Age of 5
In terms of child poverty under the age of 5, the demographic groups most similar to Cubans are Alsatian (19.1%, a difference of 0.020%), Nicaraguan (19.1%, a difference of 0.11%), Nigerian (19.1%, a difference of 0.14%), Immigrants from Eritrea (19.1%, a difference of 0.16%), and Cape Verdean (19.1%, a difference of 0.34%).
| Demographics | Rating | Rank | Child Poverty Under the Age of 5 |
| Hmong | 5.0 /100 | #216 | Tragic 18.5% |
| Immigrants | Africa | 4.6 /100 | #217 | Tragic 18.6% |
| Delaware | 3.4 /100 | #218 | Tragic 18.7% |
| German Russians | 3.0 /100 | #219 | Tragic 18.8% |
| Immigrants | Azores | 2.6 /100 | #220 | Tragic 18.9% |
| Immigrants | Nigeria | 2.1 /100 | #221 | Tragic 19.0% |
| Alsatians | 1.7 /100 | #222 | Tragic 19.1% |
| Cubans | 1.7 /100 | #223 | Tragic 19.1% |
| Nicaraguans | 1.6 /100 | #224 | Tragic 19.1% |
| Nigerians | 1.6 /100 | #225 | Tragic 19.1% |
| Immigrants | Eritrea | 1.5 /100 | #226 | Tragic 19.1% |
| Cape Verdeans | 1.4 /100 | #227 | Tragic 19.1% |
| Immigrants | Sudan | 1.3 /100 | #228 | Tragic 19.2% |
| Ghanaians | 1.2 /100 | #229 | Tragic 19.2% |
| Ecuadorians | 1.2 /100 | #230 | Tragic 19.2% |
Demographics Similar to Irish by Child Poverty Under the Age of 5
In terms of child poverty under the age of 5, the demographic groups most similar to Irish are Immigrants from Syria (16.8%, a difference of 0.030%), Czechoslovakian (16.8%, a difference of 0.060%), English (16.8%, a difference of 0.22%), Venezuelan (16.8%, a difference of 0.23%), and Costa Rican (16.9%, a difference of 0.28%).
| Demographics | Rating | Rank | Child Poverty Under the Age of 5 |
| Dutch | 77.1 /100 | #153 | Good 16.7% |
| Immigrants | Venezuela | 76.0 /100 | #154 | Good 16.7% |
| South Americans | 75.1 /100 | #155 | Good 16.7% |
| Afghans | 74.4 /100 | #156 | Good 16.8% |
| Venezuelans | 73.7 /100 | #157 | Good 16.8% |
| Czechoslovakians | 72.5 /100 | #158 | Good 16.8% |
| Immigrants | Syria | 72.3 /100 | #159 | Good 16.8% |
| Irish | 72.0 /100 | #160 | Good 16.8% |
| English | 70.4 /100 | #161 | Good 16.8% |
| Costa Ricans | 69.8 /100 | #162 | Good 16.9% |
| Scottish | 68.6 /100 | #163 | Good 16.9% |
| Immigrants | Oceania | 67.6 /100 | #164 | Good 16.9% |
| Immigrants | Colombia | 66.9 /100 | #165 | Good 16.9% |
| Slavs | 64.0 /100 | #166 | Good 17.0% |
| Immigrants | Uzbekistan | 62.0 /100 | #167 | Good 17.0% |